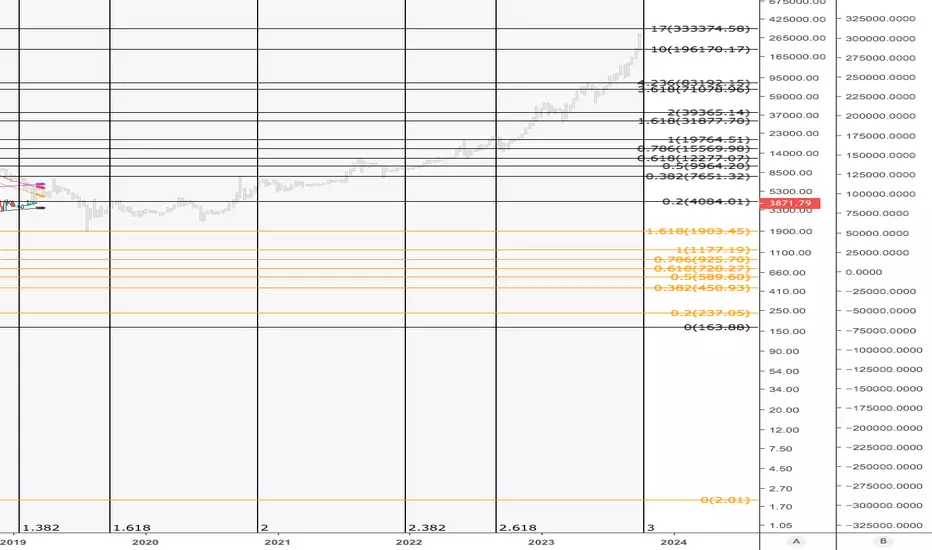
Chart Details: Brave New Coin (BTC) Bitcoin Index, Weekly.
In this chart, I utilize the fibonacci time tool to plot time divisions on two different time periods. The first time period (in orange) extends from the Nov 2011 lows of $2.01 to the Nov 2013 highs of $1177. The second period (in grey) extends from the Jan 2015 lows of $163.88 to the Dec 2017 highs of $19764.51.
In the first time period, you will see that the 3rd fib time multiple predicted the Dec 2017 highs with an accuracy of the closest week.
In the second time period, plotting the fib time multiple shows that the next all time high will come in around Oct 2023.
The grey bars on the chart that's drawn from the Dec 2017 highs is the trajectory of BTC price from the 2013 highs to the 2017 highs and superimposed on the current price cycle.
Any thoughts or comments?
면책사항
해당 정보와 게시물은 금융, 투자, 트레이딩 또는 기타 유형의 조언이나 권장 사항으로 간주되지 않으며, 트레이딩뷰에서 제공하거나 보증하는 것이 아닙니다. 자세한 내용은 이용 약관을 참조하세요.
면책사항
해당 정보와 게시물은 금융, 투자, 트레이딩 또는 기타 유형의 조언이나 권장 사항으로 간주되지 않으며, 트레이딩뷰에서 제공하거나 보증하는 것이 아닙니다. 자세한 내용은 이용 약관을 참조하세요.