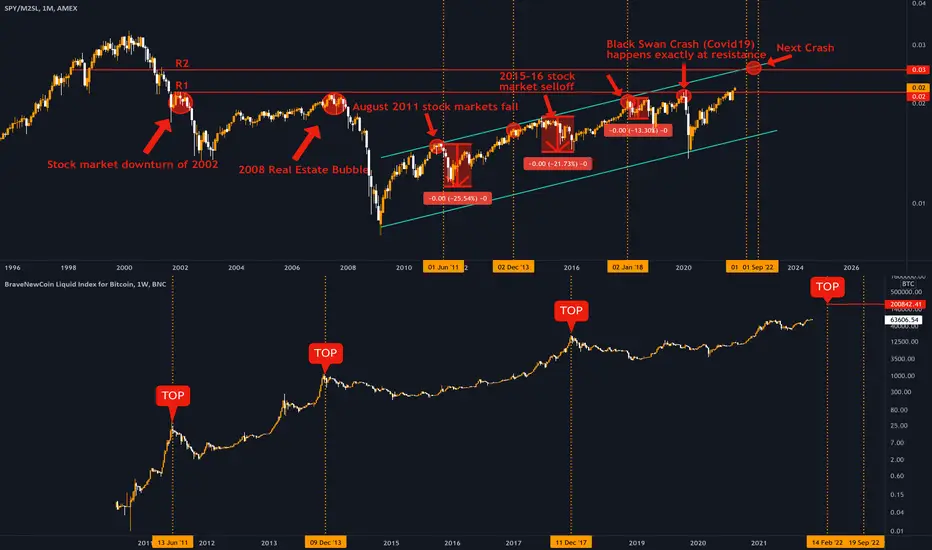
In the image above you can see two charts. The top one is that of the SPY/M2SL, which is the stock price of SPY divided by the money supply. The bottom one is that of Bitcoin. Both of the chars are extremely correlated between each other and the SPY plays a key role in determining Bitcoins future.
Black Swans are not what they seem
Have you ever heard about Black Swans? If not, you should. A black swan is the name the philosopher Nassim Taleb gave to a rare unexpected event. It’s a unique occurrence with an extreme impact on the world. Natural disasters can be called black swans or economic crashes, like 2001 Internet Bubble or the 2008 Real Estate Market Crash.
He purposely chose the Black Swan because for centuries the whole Europe agreed that all swans are white, until 1697 when miraculously black swans were discovered off the coast of Western Australia by Dutch explorers
One thing which becomes very clear looking at the chart of SPY/M2SLis that the majority of “black swans” economic events of the last decade occurred each time at important levels of resistance.
But how can this be? Aren’t they called black swans because they are unexpected?
Well yes, but they are unexpected (this is key to understand) for the majority of people. There are people ( ex. Michael Burry), which thanks to their knowledge about the markets, they will anticipate these events long before they happen. Most of the people might call this luck, but that could not be further from the truth. The market has an order behind it. There is no accident indicators like Fibonacci or support and resistance work.
Knowing and understanding this order gives one the ability to better understand the future. Not to know with 100% certainty, but *to better understand it..
Know looking at the chart we have an important level of resistance which market the top in 2001 before the Dot Com Crash. Interestingly the next time we got to this level we had the 2008 market crash. And when did we get close to it again? January 2020, before the Covid crash
While this may seem like pure coincidences, they are not. The price structure of an asset reveals many things about it. This is the core of technical analysis. They call it “the market discount everything”, meaning the markets reflect every possible knowable factor that affects overall supply and demand.
The Correlation with Bitcoin
Bitcoin is a rising asset, which in the past decade has become the best asset performer in history going from $0.01 to $68,000. Yet, even at this point this digital new asset has not reached the capital there is in the stocks, and because of that it depends on the fate of it, the same thing like altcoins do in regards to Bitcoin.
There are many models which discuss when Bitcoin next top will be, among the most famous ones are Stock to Flow or the pi Cycle indicator, and this are all good, but few have paid attention to the correlation with the SPY, not with the normal SPY chart, but with the SPY/M2SL chart which takes in consideration the money supply.
Here’s some interesting observations:
- since 2008, the price action of the SPY has been forming an ascending parallel channel
- 2009 also correspond with the release of Bitcoin
- each time the price touched the top diagonal of the channel, Bitcoin was very close to its Top
(2011, 2013, 2017)
What can we understand from it then ?
Well, if you look at where the price of the SPY now is you cans see it’s getting very close to the diagonal again. It now went past to the 2011 resistance and it is going to another level. At this rate of increase the Top of the channel should be reached anywhere from April 2022 to Nov 2022.
We now have a time zone which indicates a possibility of a very sharp correction, not only for Bitcoin but for the whole economy. A lot of factors are already giving many clues we are in a bubble. The prices of stocks are rising beyond their intrinsic value (Tesla), inflation is increasing, the economy is not working at 100% capacity, supply chains are slowed down and the pandemic narrative continues to affect small businesses while tech giants are increasing their markets dominance.
We are living in a bubble. A bubble which has been ignored for 13 years. All is fine and good until the perfect black swan come in, taking the most people by surprise. Yet, in hindsight it was all inevitable
King
면책사항
이 정보와 게시물은 TradingView에서 제공하거나 보증하는 금융, 투자, 거래 또는 기타 유형의 조언이나 권고 사항을 의미하거나 구성하지 않습니다. 자세한 내용은 이용 약관을 참고하세요.
King
면책사항
이 정보와 게시물은 TradingView에서 제공하거나 보증하는 금융, 투자, 거래 또는 기타 유형의 조언이나 권고 사항을 의미하거나 구성하지 않습니다. 자세한 내용은 이용 약관을 참고하세요.