NSE: BLUESTARCO | Timeframe: Daily
🔥 Key Observation:
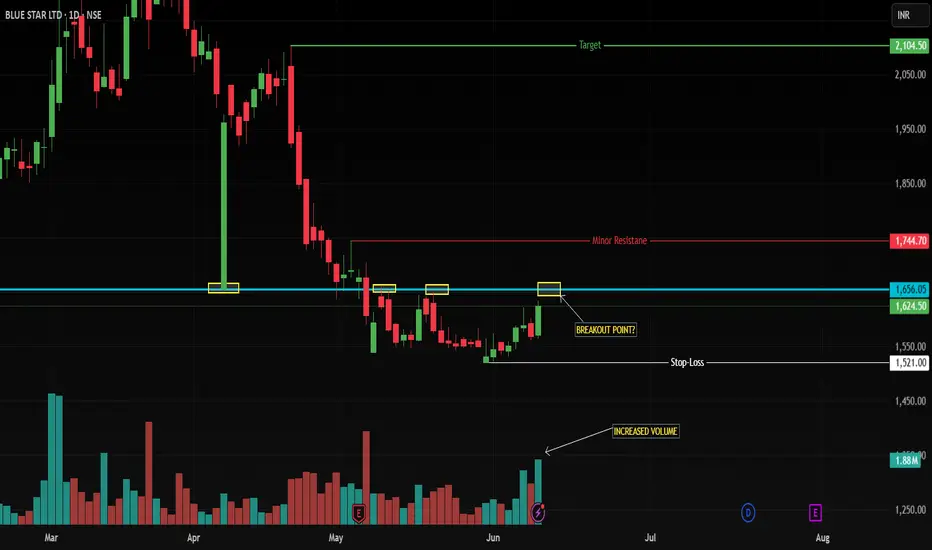
BlueStar is painting a textbook Rounding Bottom reversal pattern – a bullish signal indicating exhaustion of sellers and accumulation by smart money. Current price (1624.50) is coiling near the make-or-break resistance at 1656. A breakout here could ignite a massive rally!
🎯 Trade Plan: Precision Execution
⏱️ TRIGGER:
BUY ONLY ON CONFIRMED BREAKOUT ABOVE 1656
Must see: Strong green candle + Volume > 20% above average
NO BREAKOUT = NO TRADE. Period.
🧯 STOP LOSS (SL):
1521 (swing low below pattern – technical invalidation)
Risk: Just 8.1% from 1656 entry.
🎯 TARGETS:
TP1: 1744 (minor resistance – book 50% here)
TP2: 2100 (measured move target – 27%+ from breakout)
Reward/Risk: 8.4x (Rare asymmetry!)
📊 Why This Works:
Rounding Bottom: Classic reversal pattern after a downtrend – signals long-term trend shift.
Volume Confirmation: Breakout with rising volume = institutional participation.
SL Placement: Below the pattern’s trough (1521) invalidates the setup.
Target Rationale: 2100 aligns with the historical liquidity zone.
🚨 Critical Risk Controls
❗ NO BREAKOUT = NO TRADE.
❗ If breakout lacks volume, REJECT the trade.
❗ Partial exit at 1744: Trail SL to 1650 (breakeven) for remainder.
💡 Trader Psychology Edge
FOMO KILLS: Chasing before 1656 risks getting trapped in fakeouts.
Patience = Profit: Wait for the market’s confirmation – this is where pros separate from amateurs.
Trade Like a Sniper: One clean shot at 1656+volume, or walk away.
Disclaimer: This is not financial advice. Always do your own research. Charts are for educational purposes.
🔥 Key Observation:
BlueStar is painting a textbook Rounding Bottom reversal pattern – a bullish signal indicating exhaustion of sellers and accumulation by smart money. Current price (1624.50) is coiling near the make-or-break resistance at 1656. A breakout here could ignite a massive rally!
🎯 Trade Plan: Precision Execution
⏱️ TRIGGER:
BUY ONLY ON CONFIRMED BREAKOUT ABOVE 1656
Must see: Strong green candle + Volume > 20% above average
NO BREAKOUT = NO TRADE. Period.
🧯 STOP LOSS (SL):
1521 (swing low below pattern – technical invalidation)
Risk: Just 8.1% from 1656 entry.
🎯 TARGETS:
TP1: 1744 (minor resistance – book 50% here)
TP2: 2100 (measured move target – 27%+ from breakout)
Reward/Risk: 8.4x (Rare asymmetry!)
📊 Why This Works:
Rounding Bottom: Classic reversal pattern after a downtrend – signals long-term trend shift.
Volume Confirmation: Breakout with rising volume = institutional participation.
SL Placement: Below the pattern’s trough (1521) invalidates the setup.
Target Rationale: 2100 aligns with the historical liquidity zone.
🚨 Critical Risk Controls
❗ NO BREAKOUT = NO TRADE.
❗ If breakout lacks volume, REJECT the trade.
❗ Partial exit at 1744: Trail SL to 1650 (breakeven) for remainder.
💡 Trader Psychology Edge
FOMO KILLS: Chasing before 1656 risks getting trapped in fakeouts.
Patience = Profit: Wait for the market’s confirmation – this is where pros separate from amateurs.
Trade Like a Sniper: One clean shot at 1656+volume, or walk away.
Disclaimer: This is not financial advice. Always do your own research. Charts are for educational purposes.
액티브 트레이드
Solid breakout happened today. Entry executed today ! 노트
Coming for a retest at the same level.면책사항
이 정보와 게시물은 TradingView에서 제공하거나 보증하는 금융, 투자, 거래 또는 기타 유형의 조언이나 권고 사항을 의미하거나 구성하지 않습니다. 자세한 내용은 이용 약관을 참고하세요.
면책사항
이 정보와 게시물은 TradingView에서 제공하거나 보증하는 금융, 투자, 거래 또는 기타 유형의 조언이나 권고 사항을 의미하거나 구성하지 않습니다. 자세한 내용은 이용 약관을 참고하세요.