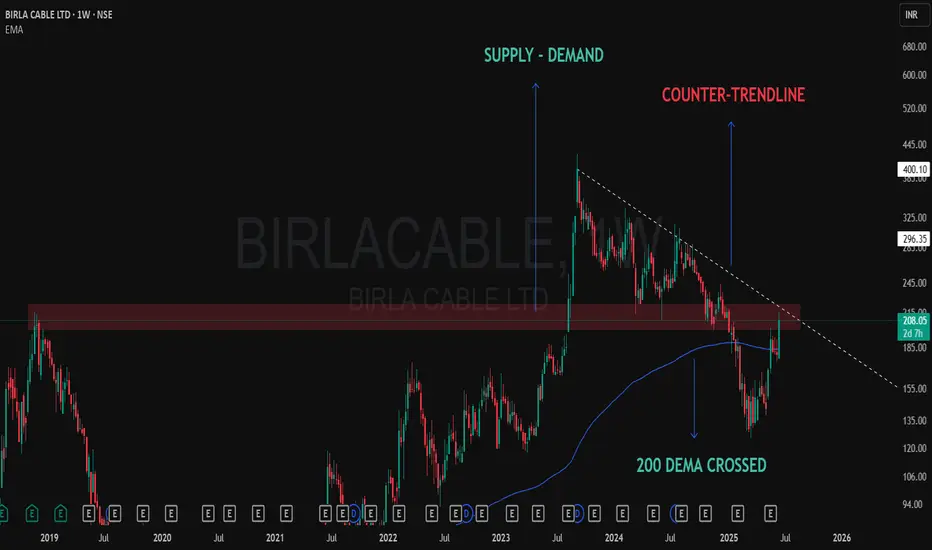
📈 BIRLA CABLE – Chart Talking Loud Now!
✅ 200 DEMA crossed
200 Dema was providing solid resistance and now taken out marked with blue line.
❌ At Counter-Trendline
Solid CT thrown from the top of the pattern, dotted white line shows that.
✅ Demand Zone Holding Strong
Clearly shown a solid supply zone which got converted into a Demand only after the Breakout some months back.
After months of consolidation and rejection from the same supply zone… price is now attacking with volume 🔥
🧠 “When structure aligns with emotionless patience, conviction follows.”
🎯 Master My Self-Made Trading Strategy
📈 Telegram (Learn Today): t.me/hashtaghammer
✅ WhatsApp (Learn Today): wa.me/919455664601
📈 Telegram (Learn Today): t.me/hashtaghammer
✅ WhatsApp (Learn Today): wa.me/919455664601
관련 발행물
면책사항
해당 정보와 게시물은 금융, 투자, 트레이딩 또는 기타 유형의 조언이나 권장 사항으로 간주되지 않으며, 트레이딩뷰에서 제공하거나 보증하는 것이 아닙니다. 자세한 내용은 이용 약관을 참조하세요.