Daily Chart (1D)
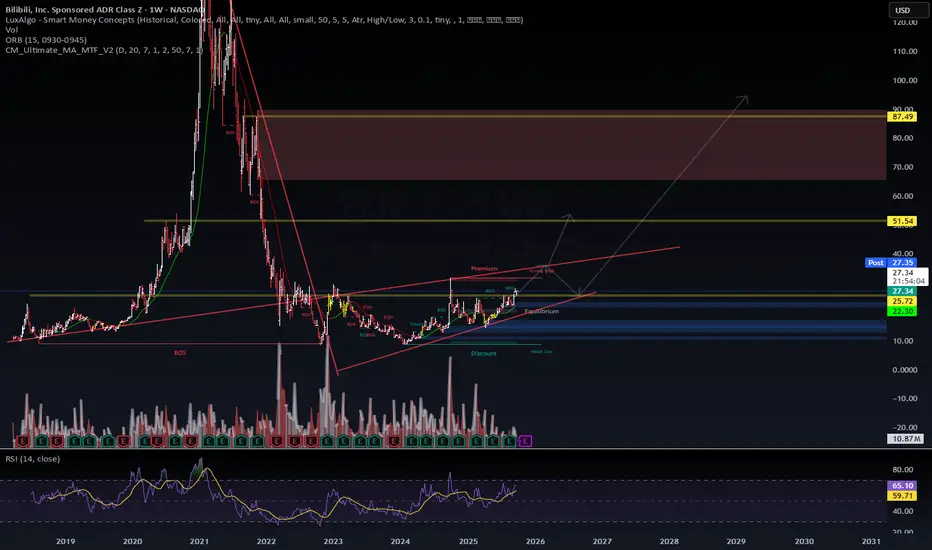
Current Price: ~$27.35 (+4.07%)
Support Zone: $25.72 (prior consolidation, breakout retest level)
Trend Structure: Price is following a rising wedge/ascending channel since early 2023.
Near-term Target: $32–$35 (upper wedge resistance).
Breakout Path: If price closes above $36 with strong volume, the path opens toward $51.54.
Long-term Path: Above $51.54, next major resistance = $87.49 (2021 breakdown pivot).
Weekly Chart (1W)
Volume Profile: Heavy accumulation between $20–$27 confirms strong demand.
Order Blocks:
Discount Zone: $22.30–$25.72 = accumulation/buy zone.
Premium Zone: ~$36–$52 = profit-taking / distribution zone.
RSI: 65 (bullish momentum, not yet overbought).
Macro Resistance: $51.54 key breakout; $87.49–$90 is the ultimate supply zone.
Bullish Scenario: Breaks $32 → heads toward $51.54, then $87.49.
Bearish Scenario: Rejects at $32–$35, retraces to $25.72, even $22.30.
🎯 Trading Plan
Swing Long Entry: Accumulate around $25.72–$27.00 (with stop below $22.30).
First Target (T1): $32–$35 (channel resistance).
Second Target (T2): $51.54 (macro breakout level).
Extended Target (T3): $87.49–$90 (long-term supply zone).
Risk Management:
Stop-loss: ~$21.50 (below discount zone).
R:R ~ 1:3 (risking ~$5 downside for ~$15–$60 upside).
📈 Option Play (Hedge Against Manipulation)
Buy Calls: $30–$35 strikes, 6–9 months out (to capture wedge breakout).
Sell Covered Calls: Against long shares near $35 to reduce theta decay.
Protective Put: $22 strike to hedge downside.
This structure ensures profit if it breaks out, while capping risk if manipulation pushes it back into the $22 zone.
✅ Primary Bias: Bullish toward $32–$35 in the short term, with high probability of testing $51.54 in 2026. Long-term breakout toward $87 possible if China tech sentiment improves.
WaverVanir ⚡ To grow and conquer
stocktwits.com/WaverVanir | wavervanir.com | buymeacoffee.com/wavervanir
Not Investment Advice
stocktwits.com/WaverVanir | wavervanir.com | buymeacoffee.com/wavervanir
Not Investment Advice
면책사항
해당 정보와 게시물은 금융, 투자, 트레이딩 또는 기타 유형의 조언이나 권장 사항으로 간주되지 않으며, 트레이딩뷰에서 제공하거나 보증하는 것이 아닙니다. 자세한 내용은 이용 약관을 참조하세요.