The price lost important support on the daily timeframe, as you can see the market-tested several times the support before the breakout, and after it, the market retested the previous support as now resistance
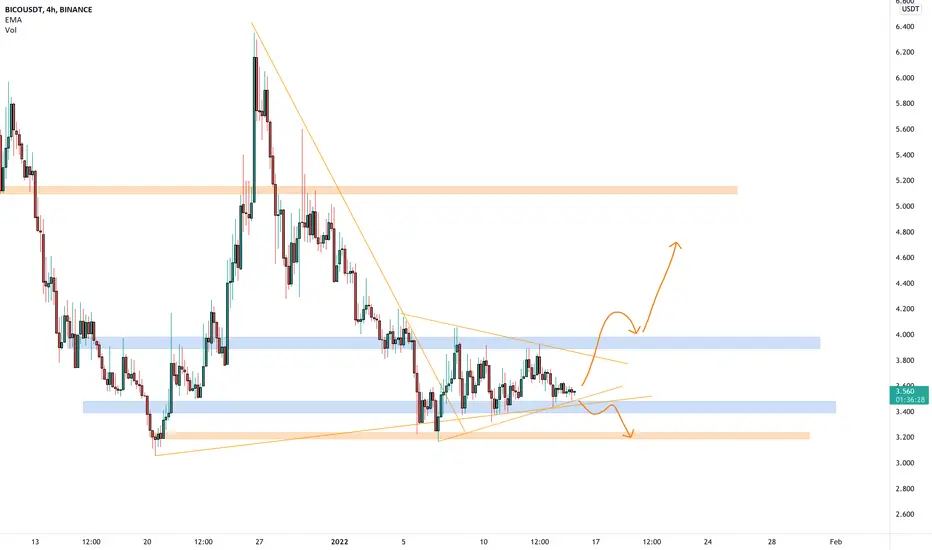
Recently, the price had a breakout from the dynamic resistance on the 4h timeframe and it's creating a pennant.
Usually, the pennant is a continuation pattern, but If the price is going to have a breakout from the 4$ (daily resistance) with volume, We could apply our rules in order to find a long opportunity.
Beware, if the price is going to lose the 3.4$ support, we could see a retest of 3.2$ where the price has a demand zone
–––––
Follow the Shrimp 🦐
Keep in mind.
- 🟣 Purple structure -> Monthly structure.
- 🔴 Red structure -> Weekly structure.
- 🔵 Blue structure -> Daily structure.
- 🟡 Yellow structure -> 4h structure.
노트
The first attempt of a breakout from the pennant.
As I said in The previous analysis, Pennant is a continuation pattern, but if the price is going to have a breakout with the retest of daily resistance (4$), we could apply our rules and look for a new long position.
노트
The price had a false breakout and got a clear rejection from daily resistance.As you can see you need to able to draw the structures and recognize the pattern on the chart, you need to study and apply your rules over and over again.
In that case, we didn't open any long position because, after a breakout from the pennant, the price never satisfy our rules. a breakout is not enough, never.
Instead, you can see how the price had a breakdown from the pennant and give us the opportunity to apply our rules for a new short position with 20% profit
노트
A perfect analysis of this pattern.
We know that Pennant is a continuation pattern, but we checked to a reversal too.
After a false breakout, the price had more continuation to the downside.
41% for everyone!
노트
The price had a bearish impulse after our call, and now the market is creating a triangle.IF the price is going to have a new breakdown we could see a new downside movement.
45% since my Free Call ✌🏻
면책사항
해당 정보와 게시물은 금융, 투자, 트레이딩 또는 기타 유형의 조언이나 권장 사항으로 간주되지 않으며, 트레이딩뷰에서 제공하거나 보증하는 것이 아닙니다. 자세한 내용은 이용 약관을 참조하세요.
면책사항
해당 정보와 게시물은 금융, 투자, 트레이딩 또는 기타 유형의 조언이나 권장 사항으로 간주되지 않으며, 트레이딩뷰에서 제공하거나 보증하는 것이 아닙니다. 자세한 내용은 이용 약관을 참조하세요.