📊 Key Technical Indicators
Relative Strength Index (RSI): 47.96 – Neutral, indicating neither overbought nor oversold conditions.
MACD: 6.55 – Strong bearish, suggesting downward momentum.
Average Directional Index (ADX): 17.09 – Neutral, indicating a weak trend.
Super Trend: ₹1,870.13 – Mild bullish, suggesting a slight upward trend.
Williams %R: -67.16 – Neutral, indicating no extreme overbought or oversold conditions.
Commodity Channel Index (CCI): -1.48 – Neutral, suggesting no strong trend.
📈 Moving Averages Analysis
Exponential Moving Averages (EMA):
5-period: ₹1,924.98 – Strong bearish.
15-period: ₹1,924.34 – Strong bearish.
50-period: ₹1,913.43 – Strong bearish.
100-period: ₹1,884.82 – Mild bullish.
Simple Moving Averages (SMA):
5-period: ₹1,927.04 – Mild bullish.
15-period: ₹1,925.39 – Mild bullish.
50-period: ₹1,909.92 – Mild bullish.
200-period: ₹1,792.48 – Mild bullish.
The alignment of moving averages indicates a generally bullish sentiment in the short term.
🔄 Trend and Volume Insights
Trend: The stock is exhibiting a mild bullish trend, supported by the Super Trend indicator and the alignment of moving averages.
Volume: An increase in trading volume could confirm the strength of the current trend.
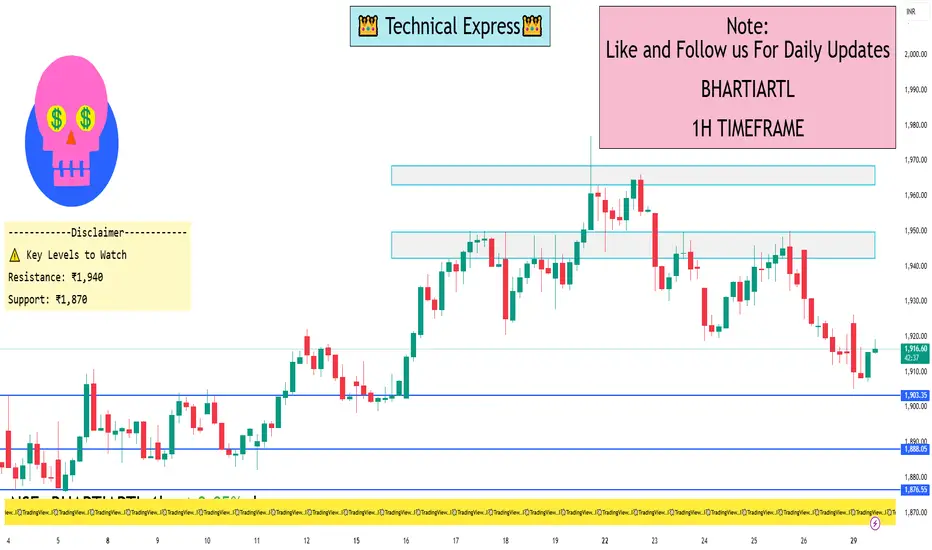
⚠️ Key Levels to Watch
Resistance: ₹1,940 – a potential barrier if the stock continues its upward movement.
Support: ₹1,870 – a level to watch for potential price rebounds.
✅ Summary
Bharti Airtel Ltd. is currently in a mild bullish phase on the 1-hour timeframe, with supportive indicators and moving averages. However, the ADX suggests weak trend strength, indicating potential consolidation. Traders should monitor key levels and volume changes for confirmation of trend continuation.
Relative Strength Index (RSI): 47.96 – Neutral, indicating neither overbought nor oversold conditions.
MACD: 6.55 – Strong bearish, suggesting downward momentum.
Average Directional Index (ADX): 17.09 – Neutral, indicating a weak trend.
Super Trend: ₹1,870.13 – Mild bullish, suggesting a slight upward trend.
Williams %R: -67.16 – Neutral, indicating no extreme overbought or oversold conditions.
Commodity Channel Index (CCI): -1.48 – Neutral, suggesting no strong trend.
📈 Moving Averages Analysis
Exponential Moving Averages (EMA):
5-period: ₹1,924.98 – Strong bearish.
15-period: ₹1,924.34 – Strong bearish.
50-period: ₹1,913.43 – Strong bearish.
100-period: ₹1,884.82 – Mild bullish.
Simple Moving Averages (SMA):
5-period: ₹1,927.04 – Mild bullish.
15-period: ₹1,925.39 – Mild bullish.
50-period: ₹1,909.92 – Mild bullish.
200-period: ₹1,792.48 – Mild bullish.
The alignment of moving averages indicates a generally bullish sentiment in the short term.
🔄 Trend and Volume Insights
Trend: The stock is exhibiting a mild bullish trend, supported by the Super Trend indicator and the alignment of moving averages.
Volume: An increase in trading volume could confirm the strength of the current trend.
⚠️ Key Levels to Watch
Resistance: ₹1,940 – a potential barrier if the stock continues its upward movement.
Support: ₹1,870 – a level to watch for potential price rebounds.
✅ Summary
Bharti Airtel Ltd. is currently in a mild bullish phase on the 1-hour timeframe, with supportive indicators and moving averages. However, the ADX suggests weak trend strength, indicating potential consolidation. Traders should monitor key levels and volume changes for confirmation of trend continuation.
I built a Buy & Sell Signal Indicator with 85% accuracy.
📈 Get access via DM or
WhatsApp: wa.link/d997q0
Contact - +91 76782 40962
| Email: techncialexpress@gmail.com
| Script Coder | Trader | Investor | From India
📈 Get access via DM or
WhatsApp: wa.link/d997q0
Contact - +91 76782 40962
| Email: techncialexpress@gmail.com
| Script Coder | Trader | Investor | From India
관련 발행물
면책사항
해당 정보와 게시물은 금융, 투자, 트레이딩 또는 기타 유형의 조언이나 권장 사항으로 간주되지 않으며, 트레이딩뷰에서 제공하거나 보증하는 것이 아닙니다. 자세한 내용은 이용 약관을 참조하세요.