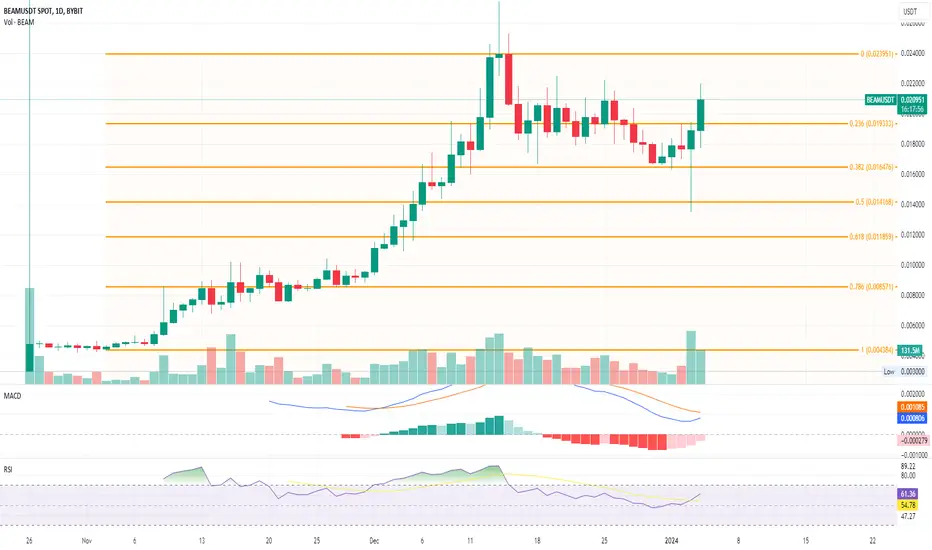
Current Momentum: BEAM price is showing signs of a bullish reversal, currently trading at $0.02187 with a significant 15% intraday increase.
Key Developments: Recent price action hints at a potential breakout rally beyond $0.024, following a bounce back from the 38.20% Fibonacci retracement level.
Market Dynamics: The price jump comes amid a broader market pullback, indicating heightened interest from traders.
Technical Analysis:
MACD Indicator: A potential bullish crossover suggests a trend reversal, aligning with the current uptrend.
RSI Indicator: The RSI line moving above the halfway mark supports the bullish trend continuation.
Price Outlook: A successful break beyond $0.024 could pave the way for BEAM to target $0.030.
Volume Support: The increase in trading volume backs the recovery trend, adding credibility to the potential uptrend.
Potential Targets: Following the Fibonacci extension level, the price might aim for $0.030, with a stretch target at $0.035 in a high momentum scenario.
Risk Factors: A downturn below $0.020 could trigger a bearish sentiment, leading to a retest of lower support levels.
면책사항
이 정보와 게시물은 TradingView에서 제공하거나 보증하는 금융, 투자, 거래 또는 기타 유형의 조언이나 권고 사항을 의미하거나 구성하지 않습니다. 자세한 내용은 이용 약관을 참고하세요.
면책사항
이 정보와 게시물은 TradingView에서 제공하거나 보증하는 금융, 투자, 거래 또는 기타 유형의 조언이나 권고 사항을 의미하거나 구성하지 않습니다. 자세한 내용은 이용 약관을 참고하세요.