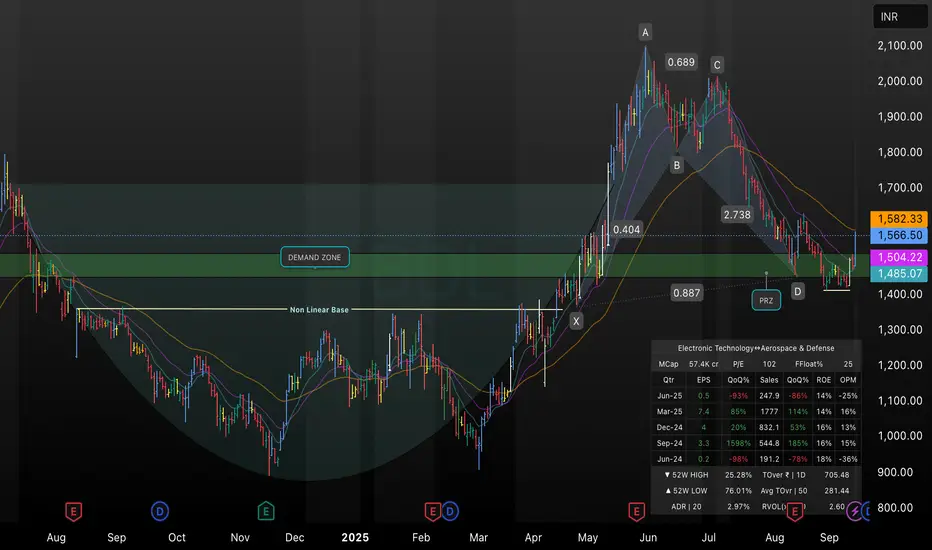
This daily chart of BDL highlights a completed bullish harmonic pattern converging with a strong demand zone between ₹1,480–₹1,510. The recent reversal from the Potential Reversal Zone (PRZ) and the overlap with the nonlinear base signal accumulation, while the confluence of 21/50 EMA suggests short-term support. Key resistance lies near ₹1,580; a break above may extend the upmove, while failure to hold ₹1,485 could invalidate the bullish setup. This chart is intended for educational and technical analysis purposes only.
면책사항
이 정보와 게시물은 TradingView에서 제공하거나 보증하는 금융, 투자, 거래 또는 기타 유형의 조언이나 권고 사항을 의미하거나 구성하지 않습니다. 자세한 내용은 이용 약관을 참고하세요.
면책사항
이 정보와 게시물은 TradingView에서 제공하거나 보증하는 금융, 투자, 거래 또는 기타 유형의 조언이나 권고 사항을 의미하거나 구성하지 않습니다. 자세한 내용은 이용 약관을 참고하세요.