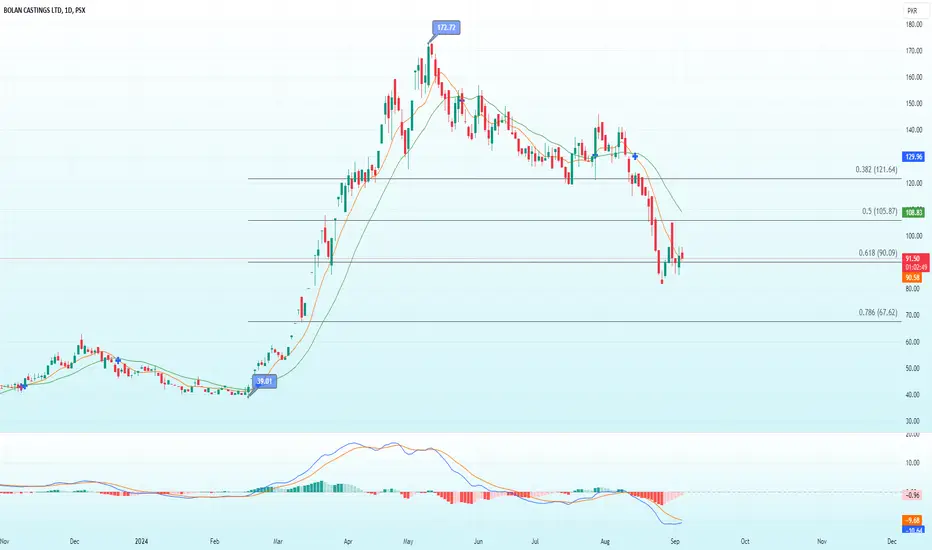
BCL is currently trading around its 200-day SMA and shows promising signs of a trend reversal. The MACD is below the zero line but nearing a bullish crossover, with the bearish histogram fading and potentially turning positive. Additionally, the stock is hovering above the 0.618 Fibonacci retracement level from Rs. 39.01 to Rs. 172.20, suggesting a potential recovery towards the 0.5 Fibonacci level at Rs. 105.87 and the 0.382 level at Rs. 121.64 (which aligns with the 50-day SMA). For a long position, consider entering as the recovery seems likely, with a stop loss set just below the previous low at Rs. 80.
노트
Testing 0.618 Fib level, sustaining above shifts bullish reversal면책사항
이 정보와 게시물은 TradingView에서 제공하거나 보증하는 금융, 투자, 거래 또는 기타 유형의 조언이나 권고 사항을 의미하거나 구성하지 않습니다. 자세한 내용은 이용 약관을 참고하세요.
면책사항
이 정보와 게시물은 TradingView에서 제공하거나 보증하는 금융, 투자, 거래 또는 기타 유형의 조언이나 권고 사항을 의미하거나 구성하지 않습니다. 자세한 내용은 이용 약관을 참고하세요.