**Technical Analysis**
**Current Trend (requires interpretation with real-time charts):**
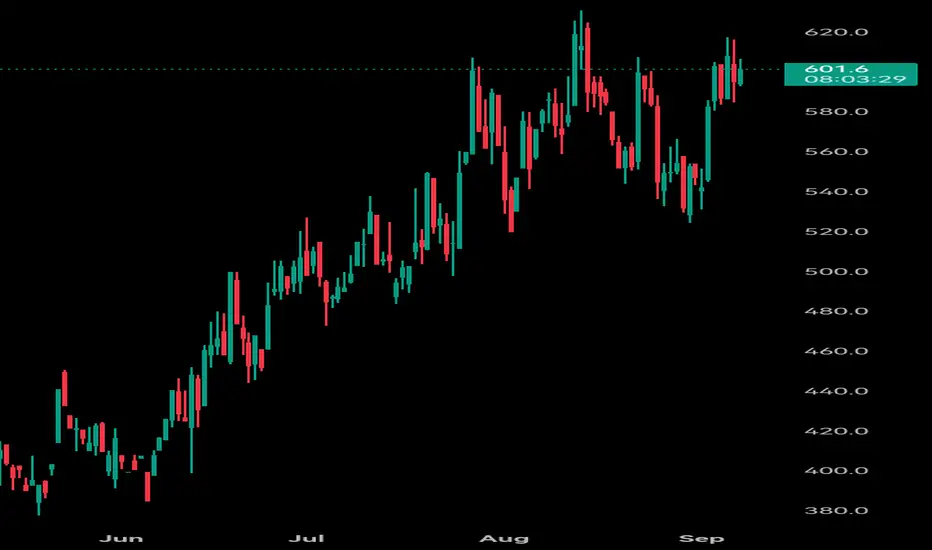
The price of BCH is currently at a critical level. Looking at the daily chart, it may be testing a **key support level** (such as a previous low or a crucial moving average, like the 200-day moving average). If it breaks below this level on high volume, it could initiate a new downward trend, potentially targeting the next major support level.
Conversely, if it finds strong support at this level accompanied by increased trading volume, it might form a short-term bottom and attempt to challenge the nearest resistance level (such as a previous high or the 50-day moving average).
**Key Indicator Signals:**
* **Volume:** Whether recent price increases are supported by high volume or declines occur on low volume is crucial for determining momentum strength.
* **RSI (Relative Strength Index):** If it is in the oversold zone below 30 and forms a bullish divergence, it might suggest an impending rebound. If it is in the overbought zone above 70, be cautious of a potential pullback.
* **MACD:** Watch for whether the DIF and DEA lines form a golden cross below the zero axis, which is one of the short-term bullish signals.
**Conclusion:**
BCH is nearing a short-term directional decision. It is essential to closely monitor its breakthrough of key support/resistance levels. The overall trend is still influenced by the broader Bitcoin market. When trading, strictly control risks and wait for high-volume confirmation of directional signals.
**Current Trend (requires interpretation with real-time charts):**
The price of BCH is currently at a critical level. Looking at the daily chart, it may be testing a **key support level** (such as a previous low or a crucial moving average, like the 200-day moving average). If it breaks below this level on high volume, it could initiate a new downward trend, potentially targeting the next major support level.
Conversely, if it finds strong support at this level accompanied by increased trading volume, it might form a short-term bottom and attempt to challenge the nearest resistance level (such as a previous high or the 50-day moving average).
**Key Indicator Signals:**
* **Volume:** Whether recent price increases are supported by high volume or declines occur on low volume is crucial for determining momentum strength.
* **RSI (Relative Strength Index):** If it is in the oversold zone below 30 and forms a bullish divergence, it might suggest an impending rebound. If it is in the overbought zone above 70, be cautious of a potential pullback.
* **MACD:** Watch for whether the DIF and DEA lines form a golden cross below the zero axis, which is one of the short-term bullish signals.
**Conclusion:**
BCH is nearing a short-term directional decision. It is essential to closely monitor its breakthrough of key support/resistance levels. The overall trend is still influenced by the broader Bitcoin market. When trading, strictly control risks and wait for high-volume confirmation of directional signals.
면책사항
이 정보와 게시물은 TradingView에서 제공하거나 보증하는 금융, 투자, 거래 또는 기타 유형의 조언이나 권고 사항을 의미하거나 구성하지 않습니다. 자세한 내용은 이용 약관을 참고하세요.
면책사항
이 정보와 게시물은 TradingView에서 제공하거나 보증하는 금융, 투자, 거래 또는 기타 유형의 조언이나 권고 사항을 의미하거나 구성하지 않습니다. 자세한 내용은 이용 약관을 참고하세요.