📊 BAT/USDT 2D Update
🔎 Technical Observation:
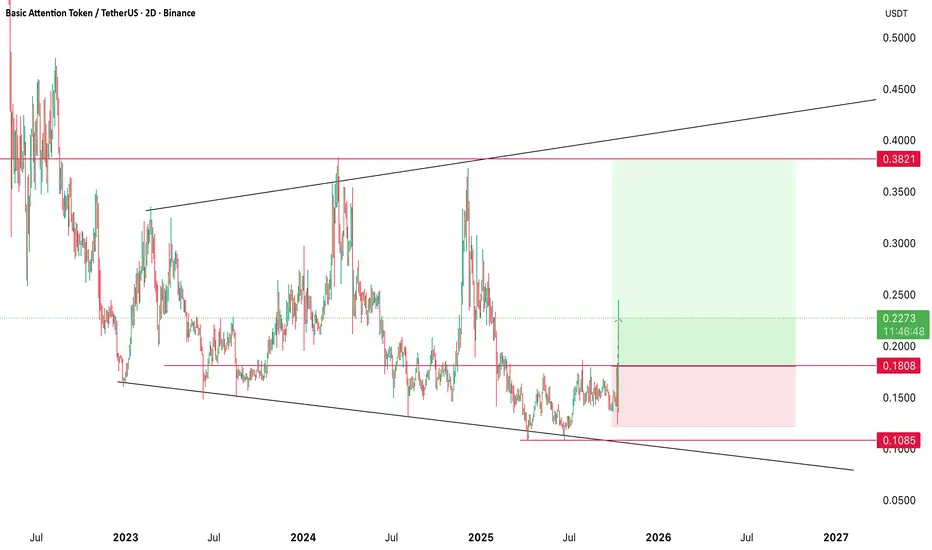
- Price is trading within a large broadening wedge (megaphone) pattern, indicating expanding volatility with higher highs and lower lows.
- The structure shows a recent, strong rejection from the lower trendline support, suggesting buying interest at these levels.
- No indicators are visible on the chart to provide additional confluence.
⚠️ Key Levels:
- Support: ~$0.1804, ~$0.1086 (lower trendline and recent low).
- Resistance: ~$0.3821 (upper trendline of the pattern).
📉 Market Outlook:
- Bullish bias for a move within the pattern. The bounce from the lower boundary is a classic sign of rotation in this type of formation.
- The most probable scenario is a continued push higher to test the upper resistance trendline. A breakdown below the ~$0.1086 low would invalidate this outlook.
💡 Trade Idea
- The analysis of the existing chart reveals a textbook long setup. Following the confirmed bounce off the lower boundary of the megaphone pattern, the price is fundamentally positioned to travel to the upper trendline. The target of ~$0.3821 represents the logical price objective for this rotation.
✅ Closing Note:
Broadening patterns inherently signal increased volatility, so prudent risk management is essential.
🔎 Technical Observation:
- Price is trading within a large broadening wedge (megaphone) pattern, indicating expanding volatility with higher highs and lower lows.
- The structure shows a recent, strong rejection from the lower trendline support, suggesting buying interest at these levels.
- No indicators are visible on the chart to provide additional confluence.
⚠️ Key Levels:
- Support: ~$0.1804, ~$0.1086 (lower trendline and recent low).
- Resistance: ~$0.3821 (upper trendline of the pattern).
📉 Market Outlook:
- Bullish bias for a move within the pattern. The bounce from the lower boundary is a classic sign of rotation in this type of formation.
- The most probable scenario is a continued push higher to test the upper resistance trendline. A breakdown below the ~$0.1086 low would invalidate this outlook.
💡 Trade Idea
- The analysis of the existing chart reveals a textbook long setup. Following the confirmed bounce off the lower boundary of the megaphone pattern, the price is fundamentally positioned to travel to the upper trendline. The target of ~$0.3821 represents the logical price objective for this rotation.
✅ Closing Note:
Broadening patterns inherently signal increased volatility, so prudent risk management is essential.
면책사항
이 정보와 게시물은 TradingView에서 제공하거나 보증하는 금융, 투자, 거래 또는 기타 유형의 조언이나 권고 사항을 의미하거나 구성하지 않습니다. 자세한 내용은 이용 약관을 참고하세요.
면책사항
이 정보와 게시물은 TradingView에서 제공하거나 보증하는 금융, 투자, 거래 또는 기타 유형의 조언이나 권고 사항을 의미하거나 구성하지 않습니다. 자세한 내용은 이용 약관을 참고하세요.