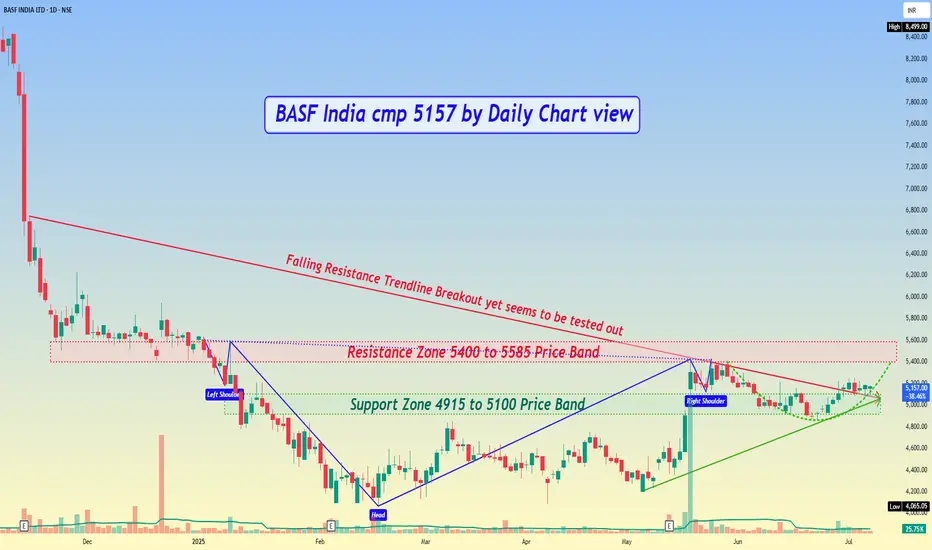
BASF India cmp 5157 by Daily Chart view
- Support Zone 4915 to 5100 Price Band
- Resistance Zone 5400 to 5585 Price Band
- Stock Price is in the process of Support Zone testing retesting
- Falling Resistance Trendline Breakout yet seems to be tested out
- Rising Support Trendline seems well respected and price well above it
- Bullish Head & Shoulder followed by a Rounding Bottom in completion stage
- Volumes seem to be on selling side, need to increase for fresh upside price movement
- Majority of the Technical Indicators seem to be turning positive for BB, EMA, MACD, RSI, SAR
면책사항
해당 정보와 게시물은 금융, 투자, 트레이딩 또는 기타 유형의 조언이나 권장 사항으로 간주되지 않으며, 트레이딩뷰에서 제공하거나 보증하는 것이 아닙니다. 자세한 내용은 이용 약관을 참조하세요.
면책사항
해당 정보와 게시물은 금융, 투자, 트레이딩 또는 기타 유형의 조언이나 권장 사항으로 간주되지 않으며, 트레이딩뷰에서 제공하거나 보증하는 것이 아닙니다. 자세한 내용은 이용 약관을 참조하세요.