🔎 Market Structure Analysis
4H Chart
Trend: Price has been in a falling channel but is attempting recovery inside a rising wedge.
Resistance: 54,350–54,450 zone (supply area + previous rejection).
Support: 53,600–53,800 (demand block + swing low).
Bias: Neutral-to-bullish short term, but the rising wedge hints at possible rejection near supply.
1H Chart
Price Action: Price bounced back from ~53,800 demand and is now consolidating around 54,000–54,150.
Fair Value Gaps (FVG): Filled around 54,050–54,150; next liquidity zone is above 54,300.
Key Levels:
Support: 53,800
Resistance: 54,350
Structure: Lower highs capped at supply, but still defending short-term trendline.
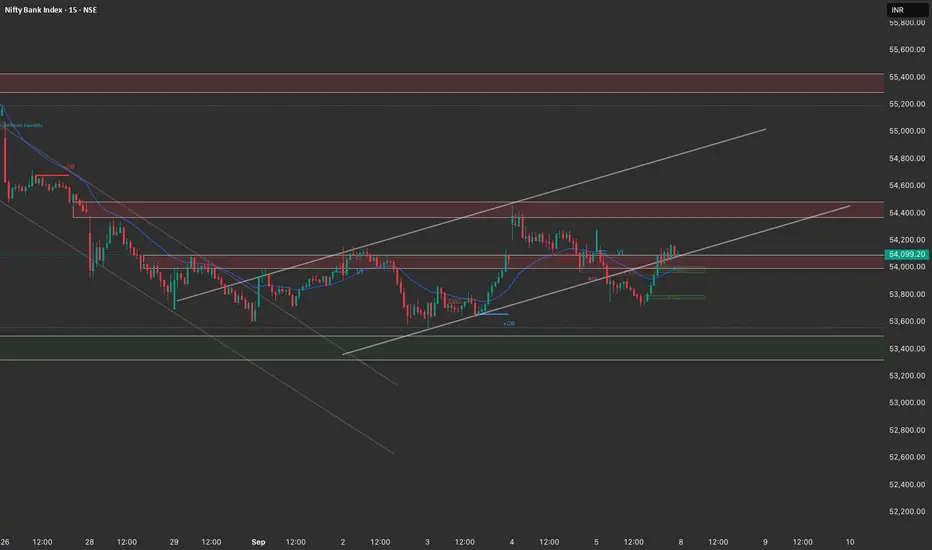
15M Chart
Intraday Structure: Market printed a Break of Structure (BOS) upwards from demand, retested 54,000, and is hovering just above trendline.
Short-Term Zones:
Demand: 53,950–54,050
Supply: 54,300–54,400
Bias: If demand holds, can push toward resistance; failure at 54,000 flips bias bearish.
🎯 Trade Plan for Monday (8th Sep)
Bullish Scenario (Long)
Entry: On 15M bullish rejection from 53,950–54,050 demand zone.
Target 1: 54,300 (previous supply).
Target 2: 54,450 (extended resistance on 4H).
Stoploss: Below 53,850.
Bearish Scenario (Short)
Entry: On rejection wicks or bearish structure shift near 54,300–54,400 supply zone.
Target 1: 54,050 (mid-level support).
Target 2: 53,800 (major demand).
Stoploss: Above 54,500.
⚖️ Summary
Intraday Bias: Range-bound between 53,800–54,400.
Breakout Levels:
Above 54,450 → opens up 54,800–55,000.
Below 53,800 → slide toward 53,400.
👉 My view: For Monday, bias stays sideways-to-slightly bullish until 54,300–54,400. Best strategy is fade supply & demand (buy dips near 53,950–54,050, short near 54,350–54,400).
4H Chart
Trend: Price has been in a falling channel but is attempting recovery inside a rising wedge.
Resistance: 54,350–54,450 zone (supply area + previous rejection).
Support: 53,600–53,800 (demand block + swing low).
Bias: Neutral-to-bullish short term, but the rising wedge hints at possible rejection near supply.
1H Chart
Price Action: Price bounced back from ~53,800 demand and is now consolidating around 54,000–54,150.
Fair Value Gaps (FVG): Filled around 54,050–54,150; next liquidity zone is above 54,300.
Key Levels:
Support: 53,800
Resistance: 54,350
Structure: Lower highs capped at supply, but still defending short-term trendline.
15M Chart
Intraday Structure: Market printed a Break of Structure (BOS) upwards from demand, retested 54,000, and is hovering just above trendline.
Short-Term Zones:
Demand: 53,950–54,050
Supply: 54,300–54,400
Bias: If demand holds, can push toward resistance; failure at 54,000 flips bias bearish.
🎯 Trade Plan for Monday (8th Sep)
Bullish Scenario (Long)
Entry: On 15M bullish rejection from 53,950–54,050 demand zone.
Target 1: 54,300 (previous supply).
Target 2: 54,450 (extended resistance on 4H).
Stoploss: Below 53,850.
Bearish Scenario (Short)
Entry: On rejection wicks or bearish structure shift near 54,300–54,400 supply zone.
Target 1: 54,050 (mid-level support).
Target 2: 53,800 (major demand).
Stoploss: Above 54,500.
⚖️ Summary
Intraday Bias: Range-bound between 53,800–54,400.
Breakout Levels:
Above 54,450 → opens up 54,800–55,000.
Below 53,800 → slide toward 53,400.
👉 My view: For Monday, bias stays sideways-to-slightly bullish until 54,300–54,400. Best strategy is fade supply & demand (buy dips near 53,950–54,050, short near 54,350–54,400).
면책사항
해당 정보와 게시물은 금융, 투자, 트레이딩 또는 기타 유형의 조언이나 권장 사항으로 간주되지 않으며, 트레이딩뷰에서 제공하거나 보증하는 것이 아닙니다. 자세한 내용은 이용 약관을 참조하세요.
면책사항
해당 정보와 게시물은 금융, 투자, 트레이딩 또는 기타 유형의 조언이나 권장 사항으로 간주되지 않으며, 트레이딩뷰에서 제공하거나 보증하는 것이 아닙니다. 자세한 내용은 이용 약관을 참조하세요.