4-Hour Chart (Macro Trend)
Structure: The long-term trend remains bullish, but the index has corrected sharply from the 55,800 - 56,000 supply zone. Crucially, the price is currently holding the major demand zone at 55,050 - 55,200. The fact that selling pressure has stalled at this level suggests bulls are defending the primary uptrend.
Key Levels:
Major Supply (Resistance): 55,800 - 56,000. This is the key reversal zone that must be breached to revive the strong uptrend.
Major Demand (Support): 55,000 - 55,200. This is the most critical support zone. It includes the psychological 55,000 mark and a prior breakout level. As long as this level holds, the market's long-term bias is still bullish.
1-Hour Chart (Intermediate View)
Structure: The 1H chart shows the Bank Nifty is trading in a consolidation range right above the main support. While the overall momentum is corrective, the index has not shown the same sharp breakdown as the Nifty. The price is challenging the lower end of its ascending channel and testing the 55,053 support.
Key Levels:
Immediate Resistance: 55,400. This level is a minor resistance that coincided with the broken ascending channel line.
Immediate Support: 55,000 - 55,200. This is the critical zone of defense. A break here would accelerate the fall.
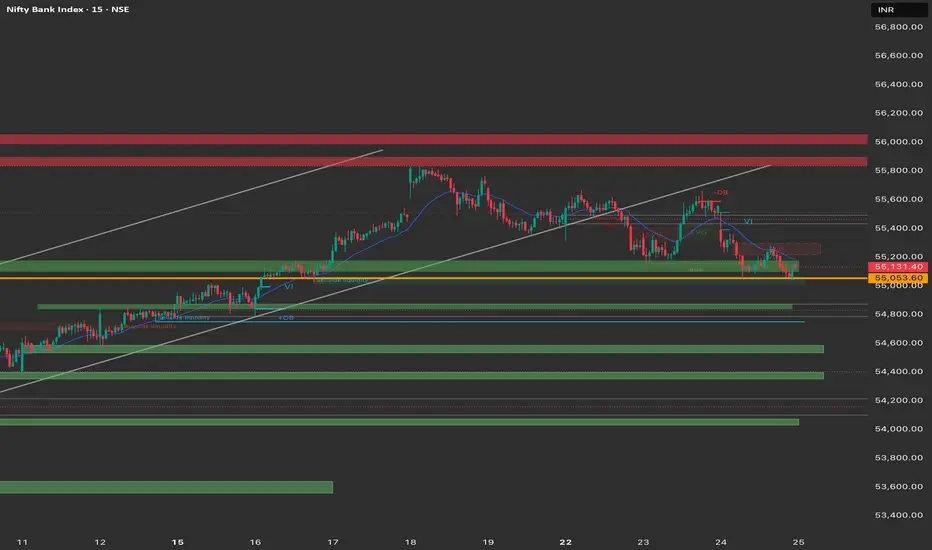
15-Minute Chart (Intraday View)
Structure: The 15M chart shows the index consolidating its losses. The Bank Nifty is highly volatile, indicating a major tussle between buyers and sellers at the 55,000 psychological mark. The price is currently trading in a tight range.
Key Levels:
Intraday Supply: 55,300. This is the top of the short-term range.
Intraday Demand: 55,100. The immediate support level that must be defended.
Outlook: The intraday bias is neutral-to-cautiously bullish due to the strong support below. However, volatility is likely to remain high ahead of the monthly expiry.
Trade Plan (Thursday, 25th September)
Market Outlook: Bank Nifty is at a major inflection point, testing a crucial support zone. The strategy must be reactive to a breakout above 55,300 or a breakdown below 55,000.
Bullish Scenario (Primary Plan)
Justification: The strong demand zone at 55,000 is likely to attract fresh buying interest, leading to a bounce and resumption of the short-term rally.
Entry: Look for a long entry on a decisive break and 15-minute candle close above 55,300.
Stop Loss (SL): Below 55,200.
Targets:
T1: 55,600 (Recent consolidation high).
T2: 55,800 (Major supply zone).
Bearish Scenario (Counter-Trend Plan)
Justification: A failure to hold the 55,000 psychological support would trigger aggressive selling, leading to a deeper correction.
Trigger: A break and sustained move (15-minute close) below 55,000.
Entry: Short entry below 55,000.
Stop Loss (SL): Above 55,150.
Targets:
T1: 54,800 (Next major FVG demand zone).
T2: 54,600 (Extension target).
Key Levels for Observation:
Immediate Decision Point: The 55,000 - 55,300 zone.
Bearish Confirmation: A break and sustained move below 55,000.
Bullish Confirmation: A recapture of the 55,300 level.
Line in the Sand: 55,000. A break below this level is a strong signal of short-term trend reversal.
Structure: The long-term trend remains bullish, but the index has corrected sharply from the 55,800 - 56,000 supply zone. Crucially, the price is currently holding the major demand zone at 55,050 - 55,200. The fact that selling pressure has stalled at this level suggests bulls are defending the primary uptrend.
Key Levels:
Major Supply (Resistance): 55,800 - 56,000. This is the key reversal zone that must be breached to revive the strong uptrend.
Major Demand (Support): 55,000 - 55,200. This is the most critical support zone. It includes the psychological 55,000 mark and a prior breakout level. As long as this level holds, the market's long-term bias is still bullish.
1-Hour Chart (Intermediate View)
Structure: The 1H chart shows the Bank Nifty is trading in a consolidation range right above the main support. While the overall momentum is corrective, the index has not shown the same sharp breakdown as the Nifty. The price is challenging the lower end of its ascending channel and testing the 55,053 support.
Key Levels:
Immediate Resistance: 55,400. This level is a minor resistance that coincided with the broken ascending channel line.
Immediate Support: 55,000 - 55,200. This is the critical zone of defense. A break here would accelerate the fall.
15-Minute Chart (Intraday View)
Structure: The 15M chart shows the index consolidating its losses. The Bank Nifty is highly volatile, indicating a major tussle between buyers and sellers at the 55,000 psychological mark. The price is currently trading in a tight range.
Key Levels:
Intraday Supply: 55,300. This is the top of the short-term range.
Intraday Demand: 55,100. The immediate support level that must be defended.
Outlook: The intraday bias is neutral-to-cautiously bullish due to the strong support below. However, volatility is likely to remain high ahead of the monthly expiry.
Trade Plan (Thursday, 25th September)
Market Outlook: Bank Nifty is at a major inflection point, testing a crucial support zone. The strategy must be reactive to a breakout above 55,300 or a breakdown below 55,000.
Bullish Scenario (Primary Plan)
Justification: The strong demand zone at 55,000 is likely to attract fresh buying interest, leading to a bounce and resumption of the short-term rally.
Entry: Look for a long entry on a decisive break and 15-minute candle close above 55,300.
Stop Loss (SL): Below 55,200.
Targets:
T1: 55,600 (Recent consolidation high).
T2: 55,800 (Major supply zone).
Bearish Scenario (Counter-Trend Plan)
Justification: A failure to hold the 55,000 psychological support would trigger aggressive selling, leading to a deeper correction.
Trigger: A break and sustained move (15-minute close) below 55,000.
Entry: Short entry below 55,000.
Stop Loss (SL): Above 55,150.
Targets:
T1: 54,800 (Next major FVG demand zone).
T2: 54,600 (Extension target).
Key Levels for Observation:
Immediate Decision Point: The 55,000 - 55,300 zone.
Bearish Confirmation: A break and sustained move below 55,000.
Bullish Confirmation: A recapture of the 55,300 level.
Line in the Sand: 55,000. A break below this level is a strong signal of short-term trend reversal.
면책사항
해당 정보와 게시물은 금융, 투자, 트레이딩 또는 기타 유형의 조언이나 권장 사항으로 간주되지 않으며, 트레이딩뷰에서 제공하거나 보증하는 것이 아닙니다. 자세한 내용은 이용 약관을 참조하세요.
면책사항
해당 정보와 게시물은 금융, 투자, 트레이딩 또는 기타 유형의 조언이나 권장 사항으로 간주되지 않으며, 트레이딩뷰에서 제공하거나 보증하는 것이 아닙니다. 자세한 내용은 이용 약관을 참조하세요.