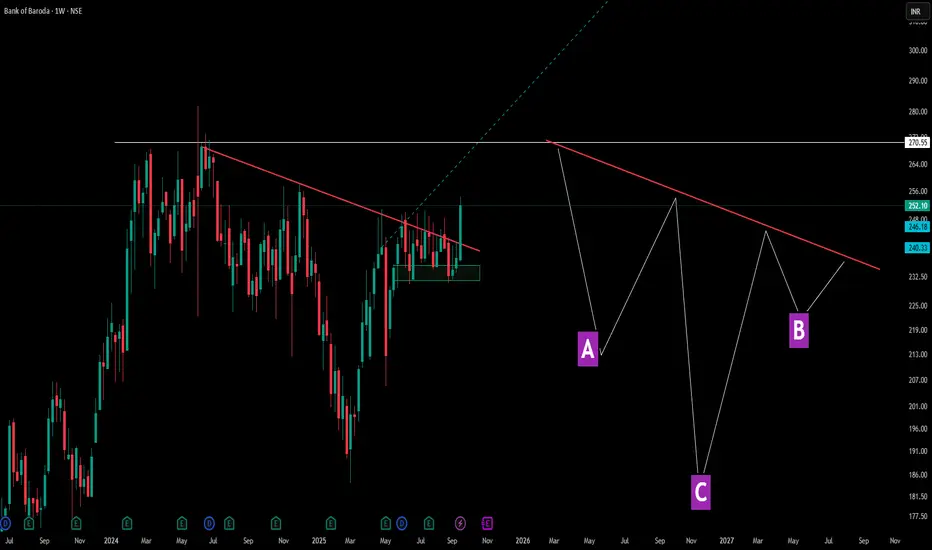
This chart showcases a perfect example of how inverted head and shoulders patterns don't always follow textbook formations. Points A and B represent the shoulders, while C forms the deeper head—but notice the crucial difference: the neckline (red line) is tilted rather than horizontal.
Pattern Education Points:
- Traditional vs Reality: While many educational materials show horizontal necklines, real market patterns frequently display angled necklines, which are equally valid
-Shoulder Structure: The left shoulder (A) and right shoulder (B) don't need perfect symmetry—market patterns reflect actual supply and demand dynamics, not geometric precision
Market Structures:
- Before A, There was serious consolidation and then a Lower Low formation in the markets -> showcasing a dry volume dip and significant correction ( marking C ) as well as a result .
- Accompanied by a decent V shape recovery, tilted neckline is been touched again - showcasing market multi structure patterns are really important and there identification can lead to a decent trade idea
- later the next shoulder ( B ) gives solid consolidation but this time the dip is not solid unlike the normal Inverted HnS which makes the 2nd dip equal to the 1st shoulder dip here its a solid consolidation with small dip and a marubozu green candle after that .
Disclaimer: This content is for educational purposes and not financial advice. Always do your own research before making trading decisions.
🎯 Master My Self-Made Trading Strategy
📈 Telegram (Learn Today): t.me/hashtaghammer
✅ WhatsApp (Learn Today): wa.me/919455664601
📈 Telegram (Learn Today): t.me/hashtaghammer
✅ WhatsApp (Learn Today): wa.me/919455664601
관련 발행물
면책사항
이 정보와 게시물은 TradingView에서 제공하거나 보증하는 금융, 투자, 거래 또는 기타 유형의 조언이나 권고 사항을 의미하거나 구성하지 않습니다. 자세한 내용은 이용 약관을 참고하세요.