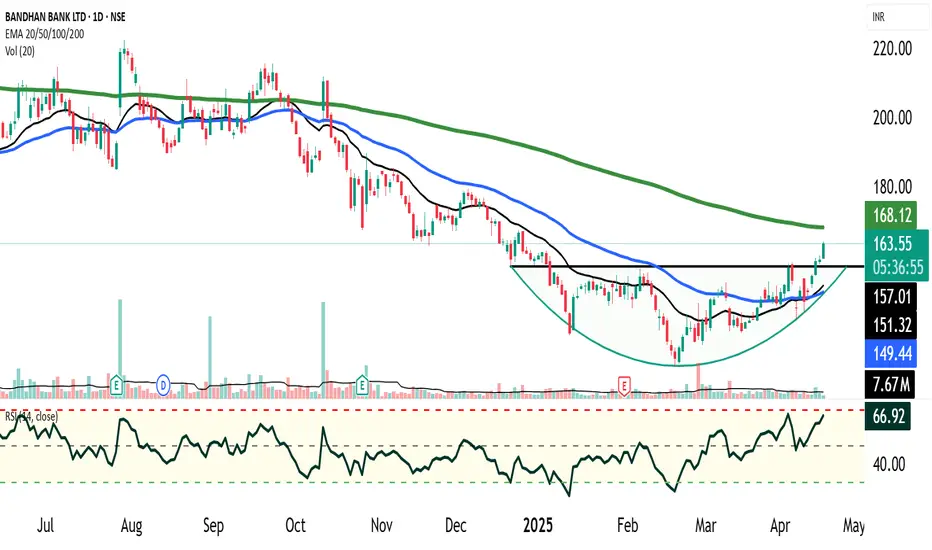
Bandhan Bank has recently formed a classic rounding bottom pattern after an extended long-term downtrend, indicating a potential shift in momentum from bearish to bullish. This basing structure suggests accumulation at lower levels and a possible trend reversal setup.
Pattern Activation: The rounding bottom pattern has triggered a breakout above the neckline resistance of ₹157, accompanied by a volume spike, confirming initial buyer interest and pattern validity.
Lack of Follow-Through Volume: Post-breakout, follow-through buying volume is missing, which raises caution. This could imply either a pause before further upside or an imminent retest of the breakout level around ₹157.
EMA Crossovers:
Bullish Crossover observed as the 20 EMA has crossed above the 50 EMA, suggesting improving short-to-medium term momentum.
However, price remains below the 200 EMA, signaling that the primary trend remains bearish. Sustained trading above the 200 EMA would be needed for confirmation of a longer-term trend reversal.
Risk Management & Strategy:
Cautious Optimism: While the breakout is promising, the stock remains under the long-term moving average and may face selling pressure at higher levels.
Retest Strategy: A pullback to ₹157 (neckline) could offer a low-risk entry point, especially if supported by bullish candlestick confirmation and renewed volume.
Staggered Investment Approach:
Do not park all your money in one go. : It is advised to invest in tranches, monitoring price action closely, especially near the 157–160 zone and at the 200 EMA level.
Conclusion:
Bandhan Bank is showing early signs of a technical base formation and potential trend reversal, but confirmation is pending due to lack of sustained volume and price being below the 200 EMA. The stock warrants close monitoring for a successful retest and possible breakout continuation. Investors should remain cautious, disciplined, and adopt a phased allocation strategy.
거래청산: 타겟 닿음
100% Target Achieved면책사항
해당 정보와 게시물은 금융, 투자, 트레이딩 또는 기타 유형의 조언이나 권장 사항으로 간주되지 않으며, 트레이딩뷰에서 제공하거나 보증하는 것이 아닙니다. 자세한 내용은 이용 약관을 참조하세요.
면책사항
해당 정보와 게시물은 금융, 투자, 트레이딩 또는 기타 유형의 조언이나 권장 사항으로 간주되지 않으며, 트레이딩뷰에서 제공하거나 보증하는 것이 아닙니다. 자세한 내용은 이용 약관을 참조하세요.