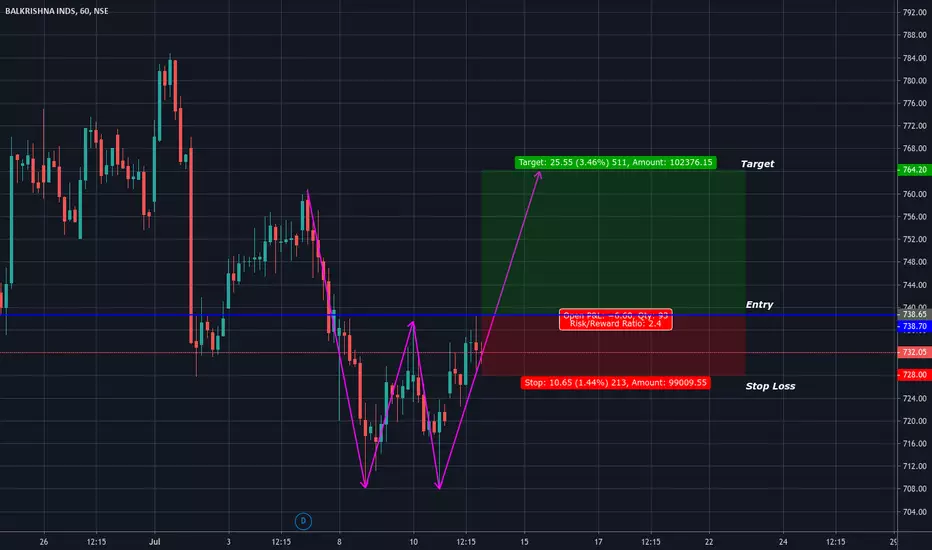
For BALKRISIND ,there is a double bottom formation in the 1 hr chart signalling the re-tracement of the daily chart downtrend has started , if the price closes above 738.5 we can go for a long
position and the target will be 764
position and the target will be 764
액티브 트레이드
The chart above with 1hr could be misleading as once the entry is triggered , the stop loss was never hit (you can refer to the 15 min chart for more details) , hence the trade is still active Do keep the stop loss intact as good discipline makes a good trader
매매 수동청산
The Trade shall be closed ,i hope the target would be hit , however on conservative case it is better to secure capital first ... Need to set a conservative target moving forward
노트
Target Reached :-) , lets keep learning !면책사항
해당 정보와 게시물은 금융, 투자, 트레이딩 또는 기타 유형의 조언이나 권장 사항으로 간주되지 않으며, 트레이딩뷰에서 제공하거나 보증하는 것이 아닙니다. 자세한 내용은 이용 약관을 참조하세요.
면책사항
해당 정보와 게시물은 금융, 투자, 트레이딩 또는 기타 유형의 조언이나 권장 사항으로 간주되지 않으며, 트레이딩뷰에서 제공하거나 보증하는 것이 아닙니다. 자세한 내용은 이용 약관을 참조하세요.