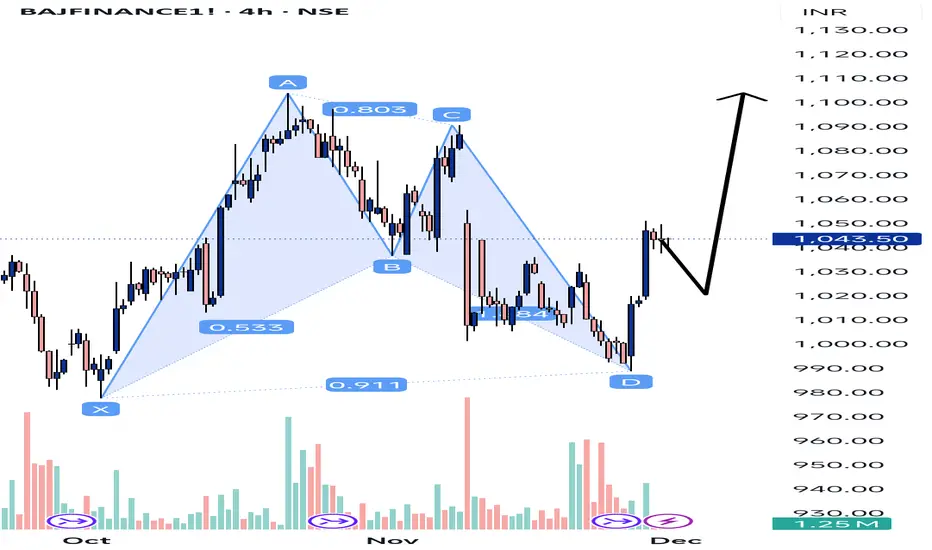
The shaded blue structure with points X – A – B – C – D is a harmonic pattern (looks like a bullish Gartley / Bat-type pattern):
X → A → B → C → D marks swings in price.
The little numbers like 0.803, 0.533, 0.911 are Fibonacci ratios used to validate the harmonic pattern.
Point D is at the bottom right – that’s usually the potential reversal zone (PRZ) where price is expected to stop falling and start moving up.
So:
👉 The pattern is suggesting bullish reversal from D (buyers stepping in around the lows near ₹990–1,000 area).
---
Current price action
After hitting D, price has bounced up and is now near ₹1,040+.
The candles from D to current level show recovery, confirming that the pattern’s reversal is (so far) working.
면책사항
해당 정보와 게시물은 금융, 투자, 트레이딩 또는 기타 유형의 조언이나 권장 사항으로 간주되지 않으며, 트레이딩뷰에서 제공하거나 보증하는 것이 아닙니다. 자세한 내용은 이용 약관을 참조하세요.
면책사항
해당 정보와 게시물은 금융, 투자, 트레이딩 또는 기타 유형의 조언이나 권장 사항으로 간주되지 않으며, 트레이딩뷰에서 제공하거나 보증하는 것이 아닙니다. 자세한 내용은 이용 약관을 참조하세요.