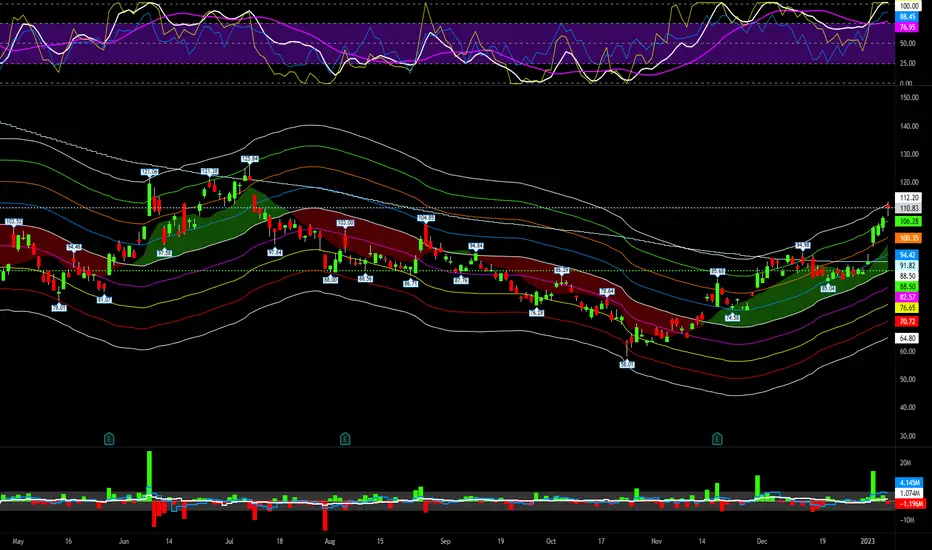
BABA is up +91% from its October 24th, 2022, low of $58 to a close of $111 today, January 9th, 2023. BABA is a high probability short now based on this technical analysis. On the BABA 1 day chart, pi RSI is getting overbought and TTCATR(beta) closed at the top of its main resistance level. Here's BABA technical levels on the 1 day chart:
SMA200 = $91.82
VWMA 20 TTCATR(beta):
top = $112.20
R3 = $106.28
R2 = $100.35
R1 = $94.42
pivot = $88.50
S1 = $82.57
S2 = $76.65
S3 = $70.72
bottom = $64.80
Do your own due diligence, your risk is 100% your responsibility. This is for educational and entertainment purposes only. You win some or you learn some. Consider being charitable with some of your profit to help humankind. Good luck and happy trading friends...
*3x lucky 7s of trading*
7pt Trading compass:
Price action, entry/exit
Volume average/direction
Trend, patterns, momentum
Newsworthy current events
Revenue
Earnings
Balance sheet
7 Common mistakes:
+5% portfolio trades, capital risk management
Beware of analyst's motives
Emotions & Opinions
FOMO : bad timing, the market is ruthless, be shrewd
Lack of planning & discipline
Forgetting restraint
Obdurate repetitive errors, no adaptation
7 Important tools:
Trading View app!, Brokerage UI
Accurate indicators & settings
Wide screen monitor/s
Trading log (pencil & graph paper)
Big, organized desk
Reading books, playing chess
Sorted watch-list
Checkout my indicators:
Fibonacci VIP - volume
Fibonacci MA7 - price
pi RSI - trend momentum
BBMC - bollinger bands
TTC - trend channel
AlertiT - notification
tickerTracker - MFI Oscillator
tradingview.com/u/growerik/
노트
My related post October 24th 2022:
Trading indicators:
tradingview.com/u/Options360/
tradingview.com/u/Options360/
면책사항
이 정보와 게시물은 TradingView에서 제공하거나 보증하는 금융, 투자, 거래 또는 기타 유형의 조언이나 권고 사항을 의미하거나 구성하지 않습니다. 자세한 내용은 이용 약관을 참고하세요.
Trading indicators:
tradingview.com/u/Options360/
tradingview.com/u/Options360/
면책사항
이 정보와 게시물은 TradingView에서 제공하거나 보증하는 금융, 투자, 거래 또는 기타 유형의 조언이나 권고 사항을 의미하거나 구성하지 않습니다. 자세한 내용은 이용 약관을 참고하세요.