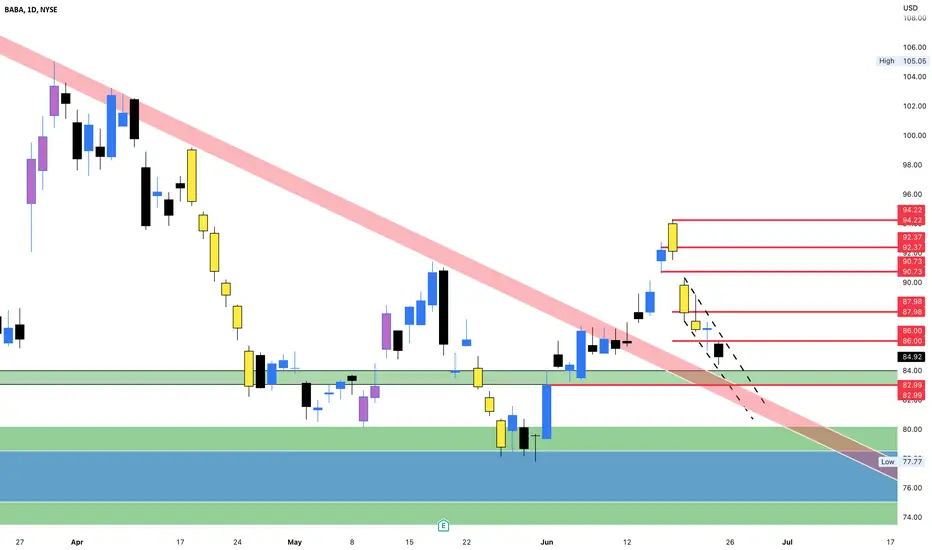
On Friday June 16th, BABA hit a daily supply area following a CHOCH on the daily as well as a breakout of a longterm down trend that began back on January 26th. BABA has since retraced into the fib golden zone (50%-61.8%). It is currently sitting on a support between 83.04 and 83.99. BABA’s price action on the daily also seems to be creating a smaller inverted head and shoulders pattern within the right shoulder of the larger head and shoulders forming on the weekly/monthly charts. Watch for price to hold this level at 83.04 and 83.99. Wait for the daily candles to start making a new high (above 86.00). Also note that the price of the previous 4 daily candles are trading within a descending channel. Drop to lower time frames (30m/1h/4h) to find a precise entry after the breakout of the descending channel and a structural change in price.
Targets: 87.98, 90.73, 92.37, 94.22
Stop: 82.98 or a break and hold below the current support between 83.04 and 83.99. ***** If price price does fail to hold watch for a retest of support turned resistance for an entry to the downside with targets of (78.10-78.83). OR watch for a reclaim of the broken support*****
액티브 트레이드
BABA is still holding the main support of interest but struggling. As long as it holds here and begin getting some bullish flow, watch for a move back above 86.00. For now? Sideways.거래청산: 타겟 닿음
TP 1 HIT! Next up ... 90.73노트
BABA has hit TP 2, 3, and 4!Dennis Butler Jr.
면책사항
해당 정보와 게시물은 금융, 투자, 트레이딩 또는 기타 유형의 조언이나 권장 사항으로 간주되지 않으며, 트레이딩뷰에서 제공하거나 보증하는 것이 아닙니다. 자세한 내용은 이용 약관을 참조하세요.
Dennis Butler Jr.
면책사항
해당 정보와 게시물은 금융, 투자, 트레이딩 또는 기타 유형의 조언이나 권장 사항으로 간주되지 않으며, 트레이딩뷰에서 제공하거나 보증하는 것이 아닙니다. 자세한 내용은 이용 약관을 참조하세요.