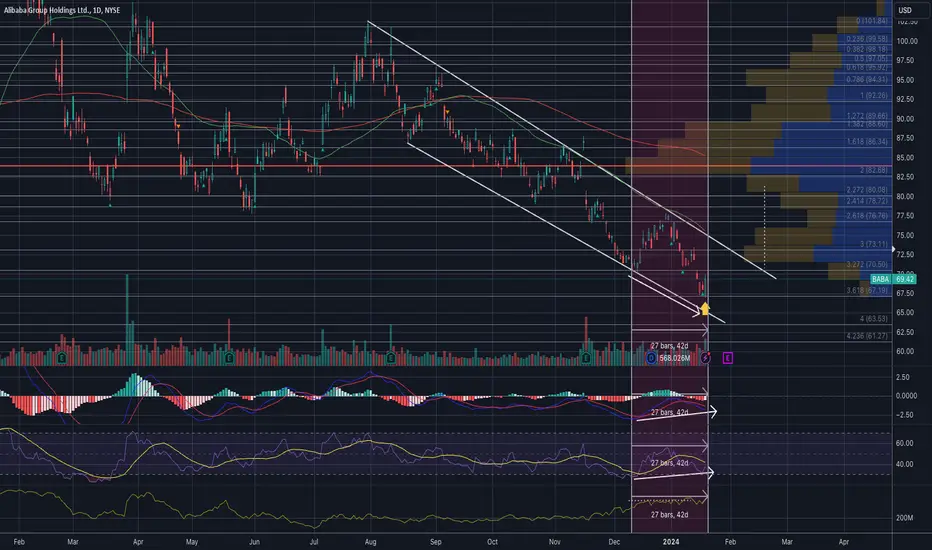
The Accumulation Distribution, MACD, and RSI all show bullish divergence, meaning accumulation is happening underneath while the price declined.
The weekly candle also printed a hammer candle, which means if the price can close above $70.50, it can see further gains.
Here are my upside targets:
$73
$76
$80
$85
Downside Risk:
$63
I post detailed technical analysis of stocks with targets. If you find my analysis helpful, please don't forget to give me a follow.
I am not a licensed professional. None of the posts that I published are investment advice. Do your own research.
면책사항
이 정보와 게시물은 TradingView에서 제공하거나 보증하는 금융, 투자, 거래 또는 기타 유형의 조언이나 권고 사항을 의미하거나 구성하지 않습니다. 자세한 내용은 이용 약관을 참고하세요.
I am not a licensed professional. None of the posts that I published are investment advice. Do your own research.
면책사항
이 정보와 게시물은 TradingView에서 제공하거나 보증하는 금융, 투자, 거래 또는 기타 유형의 조언이나 권고 사항을 의미하거나 구성하지 않습니다. 자세한 내용은 이용 약관을 참고하세요.