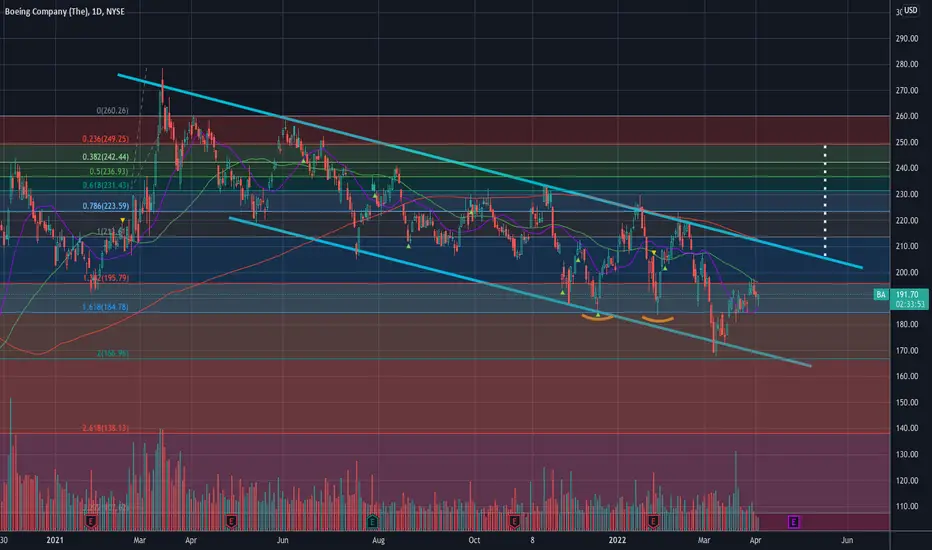
Boeing has been in a painful downtrend channel since last year. However, things are turning up in technical world.
Looking like it is heading towards the upper trendline of the channel around $210. If the break out is confirmed, the price can potentially head to $250.
Target 1 - $210
Target 2 - $250
Stop - $184 and below
———————————————————
How to read my charts?
- Matching color trend lines shows the pattern. Sometimes a chart can have multiple patterns. Each pattern will have matching color trend lines.
- The yellow horizontal lines show support and resistance areas.
- Fib lines also show support and resistance areas.
- The dotted white lines show the price projection for breakout or breakdown target.
Disclaimer: Not investment advice.
I am not a licensed professional. None of the posts that I published are investment advice. Do your own research.
면책사항
이 정보와 게시물은 TradingView에서 제공하거나 보증하는 금융, 투자, 거래 또는 기타 유형의 조언이나 권고 사항을 의미하거나 구성하지 않습니다. 자세한 내용은 이용 약관을 참고하세요.
I am not a licensed professional. None of the posts that I published are investment advice. Do your own research.
면책사항
이 정보와 게시물은 TradingView에서 제공하거나 보증하는 금융, 투자, 거래 또는 기타 유형의 조언이나 권고 사항을 의미하거나 구성하지 않습니다. 자세한 내용은 이용 약관을 참고하세요.