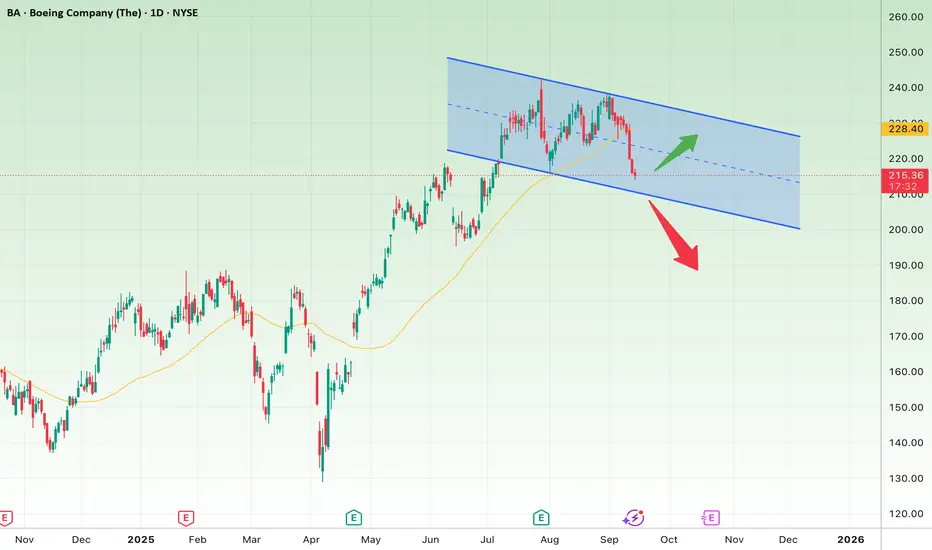
On the daily chart, Boeing (BA) has entered a descending channel after a strong rally from the $175 lows up to around $240 highs.
Bullish Scenario:
The price is currently around $215, near the channel’s lower boundary.
If this support holds and the stock reclaims the 50-day moving average (yellow line around $220), a rebound toward the channel’s upper boundary at $228 – $230 is likely.
A confirmed breakout above the channel could open the way toward $240.
Bearish Scenario:
If the $215 – $210 support zone breaks, the stock could slide down to the channel floor around $200 – $198.
A deeper breakdown below that may trigger further downside toward $185.
Conclusion:
Boeing is in a corrective channel. The $210 – $215 zone is a decisive level:
Holding it = potential rebound and short-term upside.
Breaking it = further weakness and extended downside risk.
면책사항
해당 정보와 게시물은 금융, 투자, 트레이딩 또는 기타 유형의 조언이나 권장 사항으로 간주되지 않으며, 트레이딩뷰에서 제공하거나 보증하는 것이 아닙니다. 자세한 내용은 이용 약관을 참조하세요.
면책사항
해당 정보와 게시물은 금융, 투자, 트레이딩 또는 기타 유형의 조언이나 권장 사항으로 간주되지 않으며, 트레이딩뷰에서 제공하거나 보증하는 것이 아닙니다. 자세한 내용은 이용 약관을 참조하세요.