📌 Key Levels & Data
Latest price roughly ₹1,250-₹1,260 per share.
52-week high ~ ₹1,276.10.
52-week low ~ ₹933.50.
Weekly (20-period) moving average ~ ₹1,143.27.
Weekly Bollinger Bands: Upper band ~ ₹1,285.22, Lower band ~ ₹1,001.32.
Weekly Pivot levels (Classic):
Pivot ~ ₹1,232.33
R1 ~ ₹1,255.27, R2 ~ ₹1,268.93, R3 ~ ₹1,291.87
Support S1 ~ ₹1,218.67, S2 ~ ₹1,195.73, S3 ~ ₹1,182.07
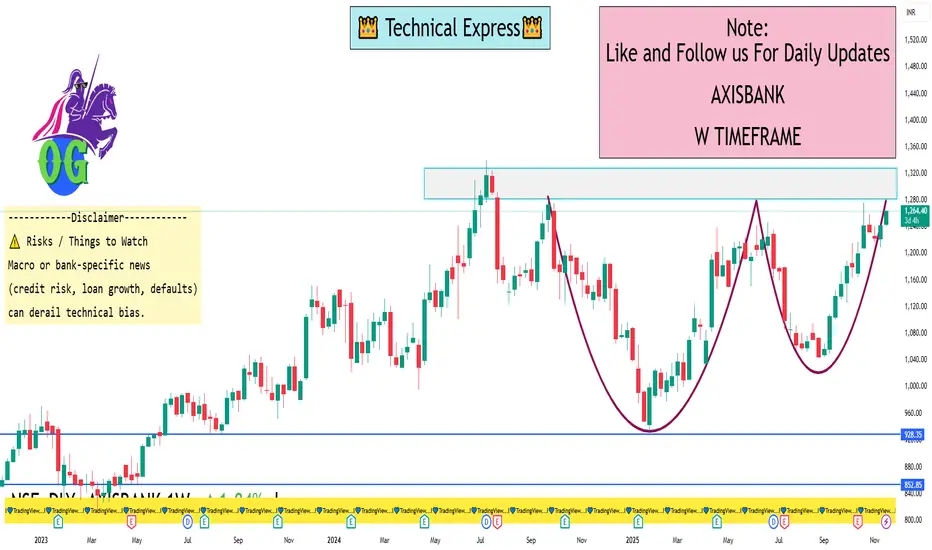
⚠️ Risks / Things to Watch
Macro or bank-specific news (credit risk, loan growth, defaults) can derail technical bias.
If weekly candle closes strongly below the 20-week SMA (or lower support), it could invalidate the bullish case.
Volume confirmation: For a strong breakout or pullback, check weekly volume — weak volume may lead to false moves.
Latest price roughly ₹1,250-₹1,260 per share.
52-week high ~ ₹1,276.10.
52-week low ~ ₹933.50.
Weekly (20-period) moving average ~ ₹1,143.27.
Weekly Bollinger Bands: Upper band ~ ₹1,285.22, Lower band ~ ₹1,001.32.
Weekly Pivot levels (Classic):
Pivot ~ ₹1,232.33
R1 ~ ₹1,255.27, R2 ~ ₹1,268.93, R3 ~ ₹1,291.87
Support S1 ~ ₹1,218.67, S2 ~ ₹1,195.73, S3 ~ ₹1,182.07
⚠️ Risks / Things to Watch
Macro or bank-specific news (credit risk, loan growth, defaults) can derail technical bias.
If weekly candle closes strongly below the 20-week SMA (or lower support), it could invalidate the bullish case.
Volume confirmation: For a strong breakout or pullback, check weekly volume — weak volume may lead to false moves.
I built a Buy & Sell Signal Indicator with 85% accuracy.
📈 Get access via DM or
WhatsApp: wa.link/d997q0
Contact - +91 76782 40962
| Email: techncialexpress@gmail.com
| Script Coder | Trader | Investor | From India
📈 Get access via DM or
WhatsApp: wa.link/d997q0
Contact - +91 76782 40962
| Email: techncialexpress@gmail.com
| Script Coder | Trader | Investor | From India
관련 발행물
면책사항
해당 정보와 게시물은 금융, 투자, 트레이딩 또는 기타 유형의 조언이나 권장 사항으로 간주되지 않으며, 트레이딩뷰에서 제공하거나 보증하는 것이 아닙니다. 자세한 내용은 이용 약관을 참조하세요.