Hello?
Traders, welcome.
If you "Follow", you can always get new information quickly.
Please also click "Boost".
Have a good day.
Thanks for your feedback on the dark mode, I made the chart in black as much as possible to match the colors used in the chart.
Please leave your thoughts on this in the comments.
-------------------------------------
(AVAXBTC 1W Chart)

If it fails to rise above 0.0008 602, I would expect a sharp decline.
--------------------------------------

------------------------------------------
(AVAXUSDT 1W Chart)

The HA-High indicator is looking to be created on 17.15.
Therefore, the key is whether it can be supported around 17.15.
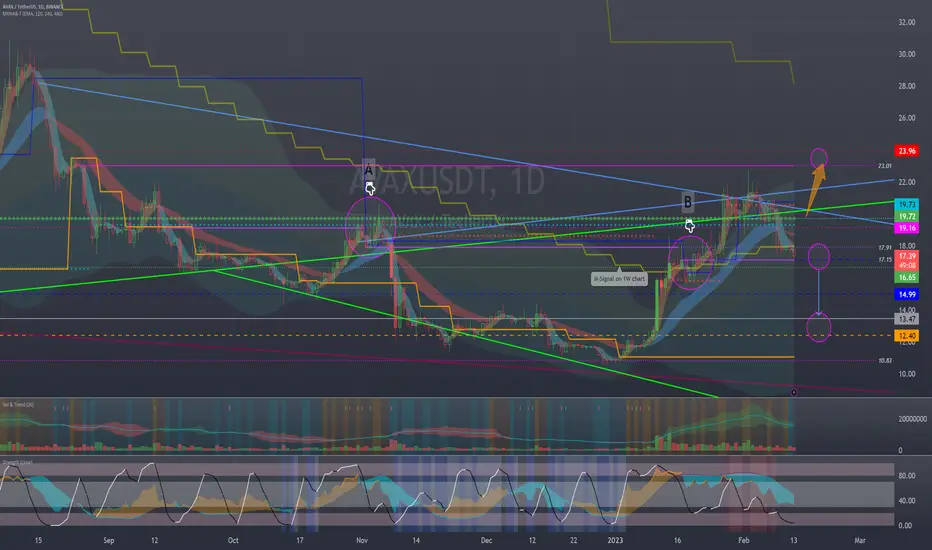
(1D chart)
Being supported and able to rise around 16.65-17.91 is important.
If not, I expect it to decline around 13.47.
-------------------------------------------------- -------------------------------------------
** All descriptions are for reference only and do not guarantee profit or loss in investment.
** If you share this chart, you can use the indicators normally.
** The MRHAB-T indicator includes indicators that indicate points of support and resistance.
** Check the formulas for the MS-Signal, HA-Low, and HA-High indicators at (tradingview.com/script/OUA6XoS6-HeikinAshi-MS-Signal-HA-MS/).
(Short-term Stop Loss can be said to be a point where profit or loss can be preserved or additional entry can be made by split trading. This is a short-term investment perspective.)
---------------------------------
Traders, welcome.
If you "Follow", you can always get new information quickly.
Please also click "Boost".
Have a good day.
Thanks for your feedback on the dark mode, I made the chart in black as much as possible to match the colors used in the chart.
Please leave your thoughts on this in the comments.
-------------------------------------
(AVAXBTC 1W Chart)
If it fails to rise above 0.0008 602, I would expect a sharp decline.
--------------------------------------
------------------------------------------
(AVAXUSDT 1W Chart)
The HA-High indicator is looking to be created on 17.15.
Therefore, the key is whether it can be supported around 17.15.
(1D chart)
Being supported and able to rise around 16.65-17.91 is important.
If not, I expect it to decline around 13.47.
-------------------------------------------------- -------------------------------------------
** All descriptions are for reference only and do not guarantee profit or loss in investment.
** If you share this chart, you can use the indicators normally.
** The MRHAB-T indicator includes indicators that indicate points of support and resistance.
** Check the formulas for the MS-Signal, HA-Low, and HA-High indicators at (tradingview.com/script/OUA6XoS6-HeikinAshi-MS-Signal-HA-MS/).
(Short-term Stop Loss can be said to be a point where profit or loss can be preserved or additional entry can be made by split trading. This is a short-term investment perspective.)
---------------------------------
※ Follow X to check out the posts.
※ X를 팔로우하고 게시물을 확인하세요.
◆ t.me/readCryptoChannel
[HA-MS Indicator]
bit.ly/3YxHgvN
[OBV Indicator]
bit.ly/4dcyny3
※ X를 팔로우하고 게시물을 확인하세요.
◆ t.me/readCryptoChannel
[HA-MS Indicator]
bit.ly/3YxHgvN
[OBV Indicator]
bit.ly/4dcyny3
관련 발행물
면책사항
이 정보와 게시물은 TradingView에서 제공하거나 보증하는 금융, 투자, 거래 또는 기타 유형의 조언이나 권고 사항을 의미하거나 구성하지 않습니다. 자세한 내용은 이용 약관을 참고하세요.