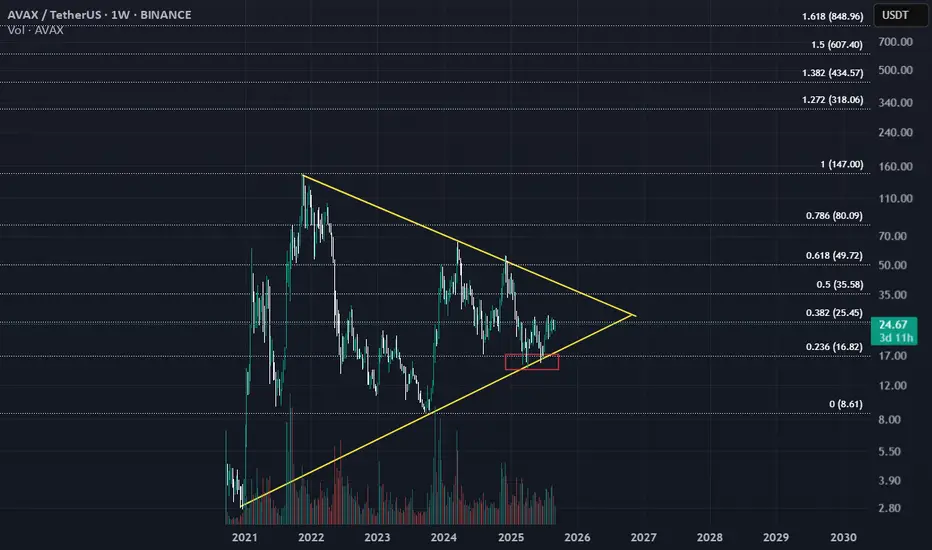
The current price of AVAX is $24.72, with a weekly high of $25.78 and a low of $22.67. The price has increased by 5.64% or $1.32 compared to the previous week's close.
The chart also displays several key technical indicators and levels:
Volume: The trading volume for the AVAX/USDT pair is shown at the bottom of the chart, with the current weekly volume at 12.03M.
Support and Resistance Levels: The chart appears to show a symmetrical triangle pattern, with the price consolidating between the support and resistance levels. The support level is around $16.82, while the resistance level is around $35.58.
Trend Lines: The chart shows along tterm triangle, indicating a potential exploding trend for the AVAX/USDT pair may be begin soon.
Note: dont forget put stop loss in each trade.
면책사항
해당 정보와 게시물은 금융, 투자, 트레이딩 또는 기타 유형의 조언이나 권장 사항으로 간주되지 않으며, 트레이딩뷰에서 제공하거나 보증하는 것이 아닙니다. 자세한 내용은 이용 약관을 참조하세요.
면책사항
해당 정보와 게시물은 금융, 투자, 트레이딩 또는 기타 유형의 조언이나 권장 사항으로 간주되지 않으며, 트레이딩뷰에서 제공하거나 보증하는 것이 아닙니다. 자세한 내용은 이용 약관을 참조하세요.