Key Technical Indicators:
Moving Averages: The stock is trading above its 200-day exponential moving average (EMA), indicating a long-term uptrend.
Stochastic RSI: The stochastic RSI is in the overbought zone, suggesting potential for a short-term pullback.
MACD: The Moving Average Convergence Divergence (MACD) is above the signal line, supporting the current bullish momentum.
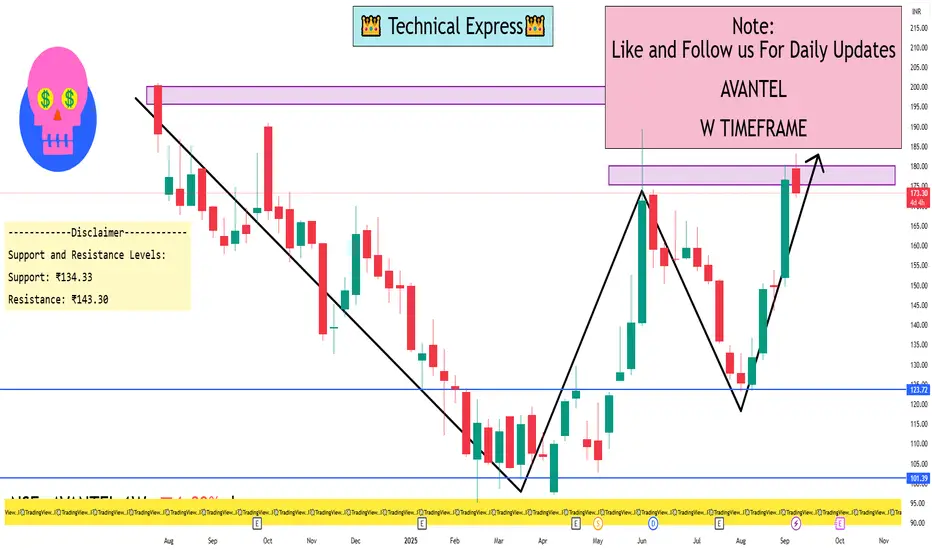
Support and Resistance Levels:
Support: ₹134.33
Resistance: ₹143.30
Moving Averages: The stock is trading above its 200-day exponential moving average (EMA), indicating a long-term uptrend.
Stochastic RSI: The stochastic RSI is in the overbought zone, suggesting potential for a short-term pullback.
MACD: The Moving Average Convergence Divergence (MACD) is above the signal line, supporting the current bullish momentum.
Support and Resistance Levels:
Support: ₹134.33
Resistance: ₹143.30
Hello Guys ..
WhatsApp link- wa.link/d997q0
Email - techncialexpress@gmail.com ...
Script Coder/Trader//Investor from India. Drop a comment or DM if you have any questions! Let’s grow together!
WhatsApp link- wa.link/d997q0
Email - techncialexpress@gmail.com ...
Script Coder/Trader//Investor from India. Drop a comment or DM if you have any questions! Let’s grow together!
관련 발행물
면책사항
이 정보와 게시물은 TradingView에서 제공하거나 보증하는 금융, 투자, 거래 또는 기타 유형의 조언이나 권고 사항을 의미하거나 구성하지 않습니다. 자세한 내용은 이용 약관을 참고하세요.