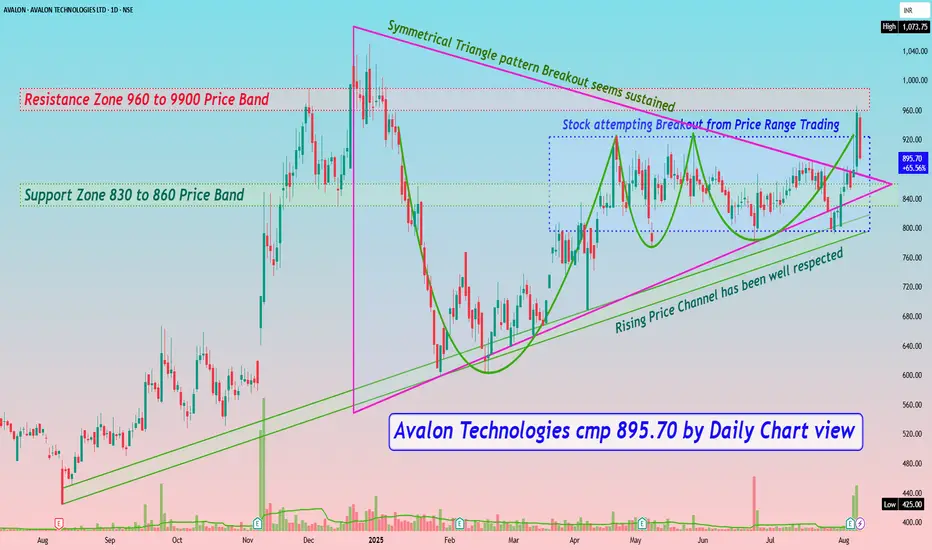
Avalon Technologies cmp 895.70 by Daily Chart view
- Support Zone 830 to 860 Price Band
- Resistance Zone 960 to 9900 Price Band
- Rising Price Channel has been well respected
- Stock attempting Breakout from Price Range Trading
- Symmetrical Triangle pattern Breakout seems sustained
- Repeated Bullish Rounding Bottoms under Resistance Zone neckline
- Volumes spiked heavily at end of week and above average traded quantity
- Positively trending Technical Indicators BB, EMA, MACD, RSI,SAR, SuperTrend
노트
Opps My bad, please read the Resistance Zone 960 to 990 Price Band, as one extra zero got typed twice.면책사항
이 정보와 게시물은 TradingView에서 제공하거나 보증하는 금융, 투자, 거래 또는 기타 유형의 조언이나 권고 사항을 의미하거나 구성하지 않습니다. 자세한 내용은 이용 약관을 참고하세요.
면책사항
이 정보와 게시물은 TradingView에서 제공하거나 보증하는 금융, 투자, 거래 또는 기타 유형의 조언이나 권고 사항을 의미하거나 구성하지 않습니다. 자세한 내용은 이용 약관을 참고하세요.