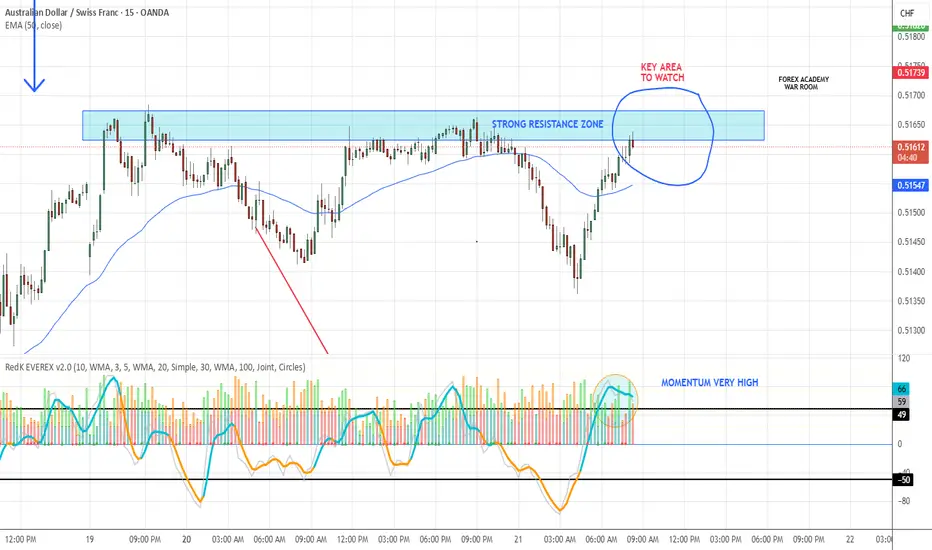
On the 15-minute timeframe, AUDCHF is pressing into a solid resistance zone. Momentum is already high, suggesting the potential for a down move.
But remember: the 15M chart can be much more volatile than higher timeframes. For a confirmed VMS setup, we still need:
✅ A clean engulfing candle to the downside
✅ Volume spike (75+) to show strong intent
Until those triggers align, this one stays on watch. Patience first — the signals will tell us when to act.
#Forex #AUDCHF #VMSStrategy #TradingView
면책사항
해당 정보와 게시물은 금융, 투자, 트레이딩 또는 기타 유형의 조언이나 권장 사항으로 간주되지 않으며, 트레이딩뷰에서 제공하거나 보증하는 것이 아닙니다. 자세한 내용은 이용 약관을 참조하세요.
면책사항
해당 정보와 게시물은 금융, 투자, 트레이딩 또는 기타 유형의 조언이나 권장 사항으로 간주되지 않으며, 트레이딩뷰에서 제공하거나 보증하는 것이 아닙니다. 자세한 내용은 이용 약관을 참조하세요.