Hi guys,
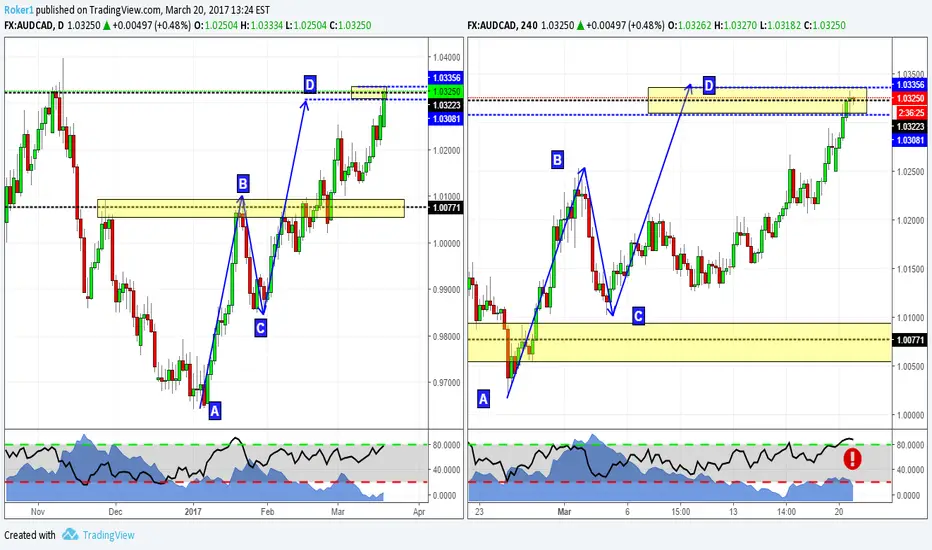
this evening i want to bring your attention on this scenario on AUDCAD. As you can see on the left hand side of your screen, price is now testing a key resistance zone on the daily timeframe. Also, it has created two different ab=cd patterns (one on the daily, one on the 4hr chart) that are going to complete right at that structure level.
RSI is in overbought condition on the 4HR.
Pay attention to price action.
I'm waiting for a sell signal.
I'll keep you updated!
If you want to share your viewpoint, or ask questions, feel free to comment below.
Otherwise, see you in the next chart!
노트
Awaiting for a double top:노트
If you were an aggressive trader, you'd probably have cashed in some profits at this time면책사항
해당 정보와 게시물은 금융, 투자, 트레이딩 또는 기타 유형의 조언이나 권장 사항으로 간주되지 않으며, 트레이딩뷰에서 제공하거나 보증하는 것이 아닙니다. 자세한 내용은 이용 약관을 참조하세요.
면책사항
해당 정보와 게시물은 금융, 투자, 트레이딩 또는 기타 유형의 조언이나 권장 사항으로 간주되지 않으며, 트레이딩뷰에서 제공하거나 보증하는 것이 아닙니다. 자세한 내용은 이용 약관을 참조하세요.