📊 Intraday Technical Levels (1-Day Time Frame)
Based on pivot point analysis and Fibonacci retracements, here are the key support and resistance levels for today:
🔹 Standard Pivot Points
Support Levels: S1: ₹709.93, S2: ₹693.88, S3: ₹683.92
Resistance Levels: R1: ₹725.98, R2: ₹732.07
🔹 Camarilla Pivot Points
Support Levels: S3: ₹701.64, S2: ₹703.11, S1: ₹704.58
Resistance Levels: R1: ₹707.52, R2: ₹708.99, R3: ₹710.46
🔹 Fibonacci Retracement Levels
Support Levels: S1: ₹700.01, S2: ₹693.06
Resistance Levels: R1: ₹719.85, R2: ₹725.72
🔹 Woodie's Pivot Points
Support Levels: S1: ₹698.02, S2: ₹692.91
Resistance Levels: R1: ₹708.96, R2: ₹714.08
🔹 Demark Pivot Points
Support Levels: S1: ₹696.92
Resistance Levels: R1: ₹712.98
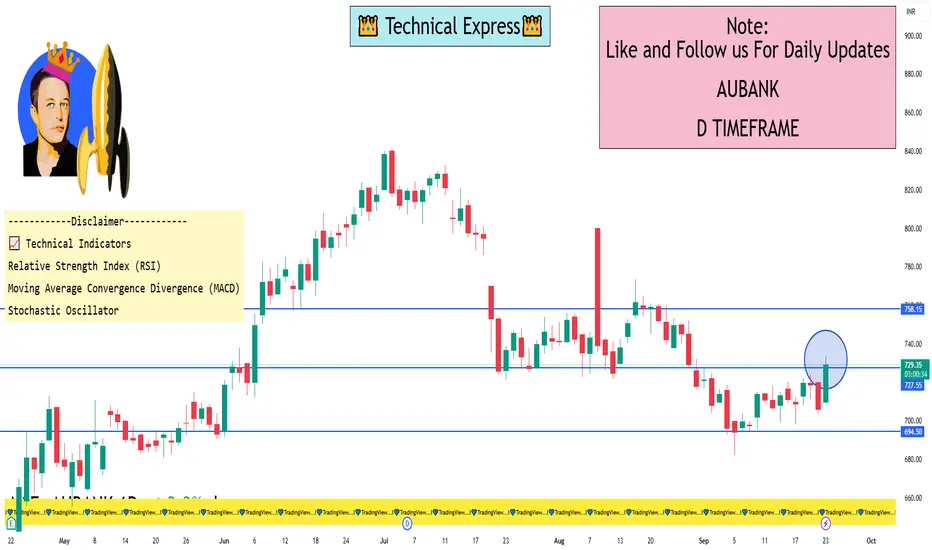
📈 Technical Indicators
Relative Strength Index (RSI): Currently at 60, indicating a bullish trend with room for further upside.
Moving Average Convergence Divergence (MACD): The MACD line is above the signal line, suggesting upward momentum.
Stochastic Oscillator: Reading between 55 and 80, indicating a bullish condition.
🔍 Summary
AU Small Finance Bank Ltd is exhibiting a bullish trend in the 1-day time frame, trading above key pivot levels. The RSI and MACD indicators support this positive outlook. Traders may consider monitoring the stock for potential breakout opportunities above resistance levels.
Based on pivot point analysis and Fibonacci retracements, here are the key support and resistance levels for today:
🔹 Standard Pivot Points
Support Levels: S1: ₹709.93, S2: ₹693.88, S3: ₹683.92
Resistance Levels: R1: ₹725.98, R2: ₹732.07
🔹 Camarilla Pivot Points
Support Levels: S3: ₹701.64, S2: ₹703.11, S1: ₹704.58
Resistance Levels: R1: ₹707.52, R2: ₹708.99, R3: ₹710.46
🔹 Fibonacci Retracement Levels
Support Levels: S1: ₹700.01, S2: ₹693.06
Resistance Levels: R1: ₹719.85, R2: ₹725.72
🔹 Woodie's Pivot Points
Support Levels: S1: ₹698.02, S2: ₹692.91
Resistance Levels: R1: ₹708.96, R2: ₹714.08
🔹 Demark Pivot Points
Support Levels: S1: ₹696.92
Resistance Levels: R1: ₹712.98
📈 Technical Indicators
Relative Strength Index (RSI): Currently at 60, indicating a bullish trend with room for further upside.
Moving Average Convergence Divergence (MACD): The MACD line is above the signal line, suggesting upward momentum.
Stochastic Oscillator: Reading between 55 and 80, indicating a bullish condition.
🔍 Summary
AU Small Finance Bank Ltd is exhibiting a bullish trend in the 1-day time frame, trading above key pivot levels. The RSI and MACD indicators support this positive outlook. Traders may consider monitoring the stock for potential breakout opportunities above resistance levels.
I built a Buy & Sell Signal Indicator with 85% accuracy.
📈 Get access via DM or
WhatsApp: wa.link/d997q0
Contact - +91 76782 40962
| Email: techncialexpress@gmail.com
| Script Coder | Trader | Investor | From India
📈 Get access via DM or
WhatsApp: wa.link/d997q0
Contact - +91 76782 40962
| Email: techncialexpress@gmail.com
| Script Coder | Trader | Investor | From India
관련 발행물
면책사항
해당 정보와 게시물은 금융, 투자, 트레이딩 또는 기타 유형의 조언이나 권장 사항으로 간주되지 않으며, 트레이딩뷰에서 제공하거나 보증하는 것이 아닙니다. 자세한 내용은 이용 약관을 참조하세요.