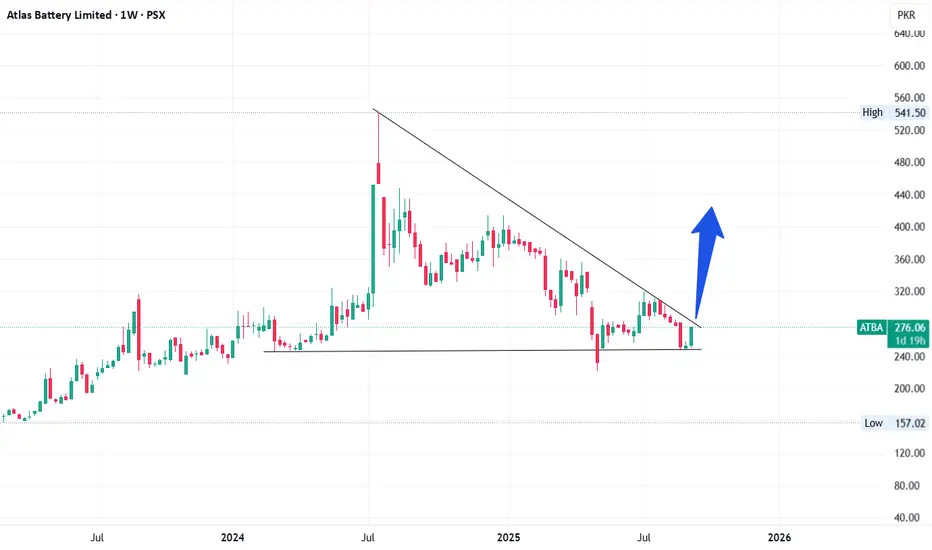
ATBA is currently taking trendline resistance as shown in chart. Once broken (weekly closing above 287), it will bounce back to its recent high (~450).
On weekly timeframe, a falling wedge pattern can be observed which is a bullish pattern.
Bad result in recent quarter may cause this trendline resistance to be a tough task to break. However, on a bigger (monthly) timeframe, a beautiful inverse head and shoulder is forming that may take its effect in coming months.
This is not a buy / sell call, be cautious while investing in fundamentally weak stocks.
Keep your stoploss at 221 (Recent low on May 7th).
면책사항
이 정보와 게시물은 TradingView에서 제공하거나 보증하는 금융, 투자, 거래 또는 기타 유형의 조언이나 권고 사항을 의미하거나 구성하지 않습니다. 자세한 내용은 이용 약관을 참고하세요.
면책사항
이 정보와 게시물은 TradingView에서 제공하거나 보증하는 금융, 투자, 거래 또는 기타 유형의 조언이나 권고 사항을 의미하거나 구성하지 않습니다. 자세한 내용은 이용 약관을 참고하세요.