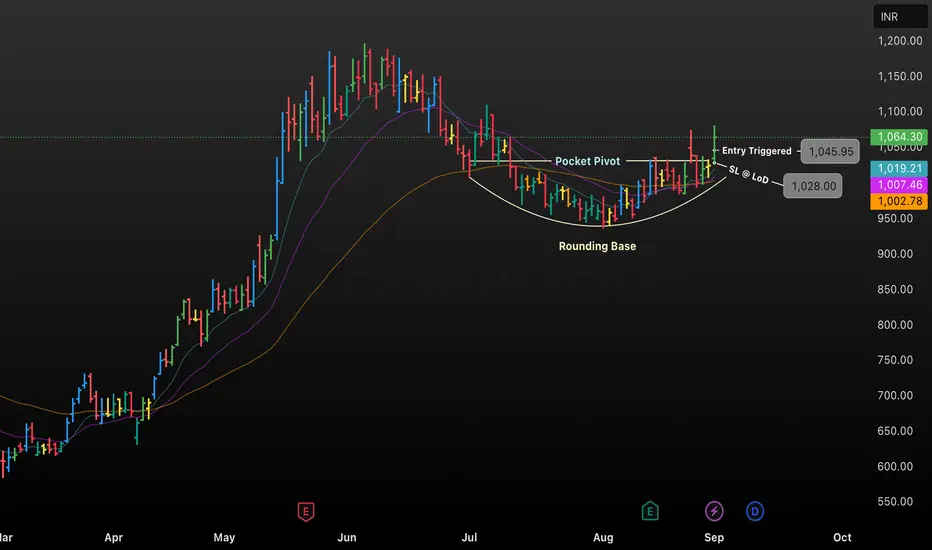
This chart from TradingView displays the price movement of ASTRAMICRO (ASTRAM) in INR over a period from March to September 2025, highlighting key technical features and trade signals.
• The chart illustrates a Rounding Base pattern forming from June through August, which suggests a period of consolidation and accumulation before a possible breakout.
• A Pocket Pivot is marked, indicating a strong buy signal based on above-average volume and price strength within the base pattern.
• The Entry Triggered level is annotated at ₹1,045.95, showing where a breakout occurred, with suggested stop-loss (SL) at the low of ₹1,028.00.
• Moving averages (colored lines) are shown for trend confirmation and support/resistance visualization, while prices are currently trading at ₹1,064.30, up 3.93% on the session.
• The chart is designed for momentum and breakout traders seeking to capitalize on price continuation following a base formation.
면책사항
이 정보와 게시물은 TradingView에서 제공하거나 보증하는 금융, 투자, 거래 또는 기타 유형의 조언이나 권고 사항을 의미하거나 구성하지 않습니다. 자세한 내용은 이용 약관을 참고하세요.
면책사항
이 정보와 게시물은 TradingView에서 제공하거나 보증하는 금융, 투자, 거래 또는 기타 유형의 조언이나 권고 사항을 의미하거나 구성하지 않습니다. 자세한 내용은 이용 약관을 참고하세요.