📊 Recent Price Snapshot
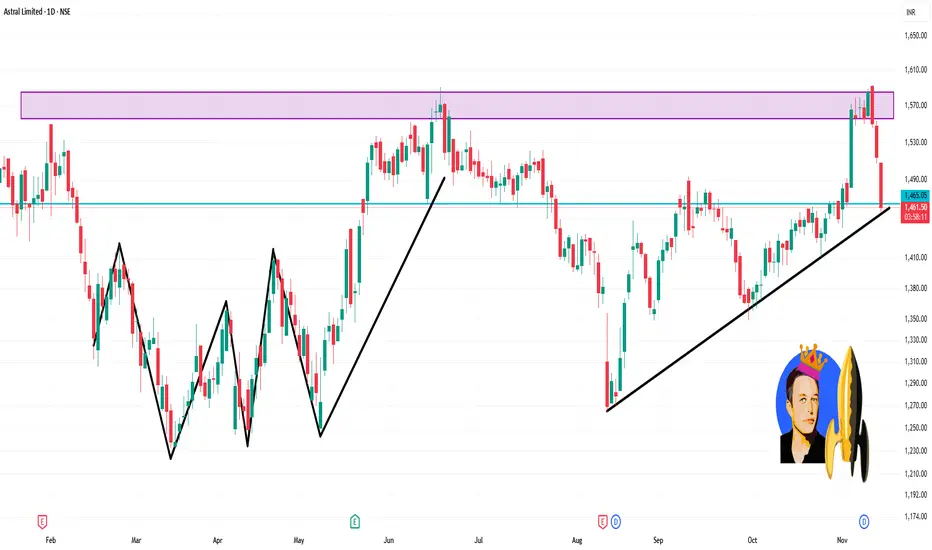
Latest closing around ₹1,460-₹1,470.
Daily range on latest day: High ~ ₹1,508, Low ~ ₹1,460.
52 week high ~ ₹1,867, 52 week low ~ ₹1,232.
🔍 Key Levels for the 1-Day Timeframe
Support Levels
Around ₹1,440–₹1,450: Recent lows touched ~1,445.
Further support nearer the 200-day SMA (~₹1,417) as per technical data.
Resistance Levels
Immediate resistance near ₹1,508 (recent high).
A stronger resistance zone around ₹1,520-₹1,550 (recent swing highs).
Price Action & Trend
The stock is trading above its 200-day average (~₹1,417) but the upward momentum appears weak.
On short term RSI/MFI metrics: MFI appears elevated (suggestive of some overbought behaviour).
관련 발행물
면책사항
해당 정보와 게시물은 금융, 투자, 트레이딩 또는 기타 유형의 조언이나 권장 사항으로 간주되지 않으며, 트레이딩뷰에서 제공하거나 보증하는 것이 아닙니다. 자세한 내용은 이용 약관을 참조하세요.
관련 발행물
면책사항
해당 정보와 게시물은 금융, 투자, 트레이딩 또는 기타 유형의 조언이나 권장 사항으로 간주되지 않으며, 트레이딩뷰에서 제공하거나 보증하는 것이 아닙니다. 자세한 내용은 이용 약관을 참조하세요.