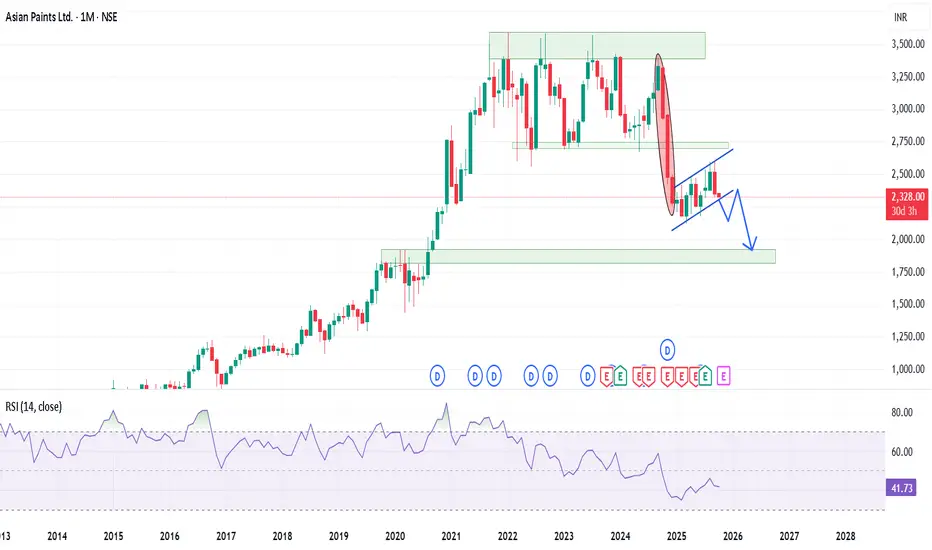
Asian paints is one of the leading paint manufacturer in country and for the last few months the stock is trading in a parallel channel there are chance of it trying to retest the previous support zone of around 2700 levels before entering into another bearish leg.
Fundamentally stock shows some negativity as ~45% YoY decline in consolidated net profit in Q4 FY25.
Revenue slipped 4.3% YoY in this quater. Net profit fell 23.3% YoY in Q3 FY 2025.
Technically too the stock look to form bearish Flag and Pole pattern with a possible retracement to around 1700-1800 levels in upcoming months.
RSI is around in between on the monthly charts which is not in confluence.
BBand shows that the stock is trading below the median line of the band and chance of it travelling to the lower band it possible as stock it below the median line for around 11 months.
Exponential moving averages : 100 EMA on the monthly charts is providing good support to the stock while 20 & 50 EMA are acting as the resistance on the same time frame.
Target are different as per the trading setup.
Support and Resistance

Entry only once the channel is breached and retested.
Targe : 1815-1925 zone.
Bollinger Band

Entry has been triggered as per the BB strategy.
Target : 1935
EMA

As per the EMA strategy, there will be multiple entries in the stock.
Entry will be made once the stock closed below the 100 EMA.
Target : 200 EMA.
Fundamentally stock shows some negativity as ~45% YoY decline in consolidated net profit in Q4 FY25.
Revenue slipped 4.3% YoY in this quater. Net profit fell 23.3% YoY in Q3 FY 2025.
Technically too the stock look to form bearish Flag and Pole pattern with a possible retracement to around 1700-1800 levels in upcoming months.
RSI is around in between on the monthly charts which is not in confluence.
BBand shows that the stock is trading below the median line of the band and chance of it travelling to the lower band it possible as stock it below the median line for around 11 months.
Exponential moving averages : 100 EMA on the monthly charts is providing good support to the stock while 20 & 50 EMA are acting as the resistance on the same time frame.
Target are different as per the trading setup.
Support and Resistance
Entry only once the channel is breached and retested.
Targe : 1815-1925 zone.
Bollinger Band
Entry has been triggered as per the BB strategy.
Target : 1935
EMA
As per the EMA strategy, there will be multiple entries in the stock.
Entry will be made once the stock closed below the 100 EMA.
Target : 200 EMA.
액티브 트레이드
A clear picture of the income of another bearish leg in the stock is prominent on 3 months charts. EMA strategy is prominent in the stock on 3 month and 1 months charts.
Another possible shorting opportunity may arrive on higher levels around 2700-50 levels.
Weekly charts are showing something opposite on the charts as an opportunity of a gap filling trade.
A breakout of 2600 levels there are chance of clearing the gap before another leg of bearish trade.
I will be waiting for the trade and short when 2750 levels are achieved.
The trade is possible in coming 1-2 months.
Entry :- 2750
Risk :- 2900 (-5.5%)
Reward :- 2170 (21%)
R:R is good, setup is fine.
Waiting for the price to trigger the entry.
관련 발행물
면책사항
이 정보와 게시물은 TradingView에서 제공하거나 보증하는 금융, 투자, 거래 또는 기타 유형의 조언이나 권고 사항을 의미하거나 구성하지 않습니다. 자세한 내용은 이용 약관을 참고하세요.
면책사항
이 정보와 게시물은 TradingView에서 제공하거나 보증하는 금융, 투자, 거래 또는 기타 유형의 조언이나 권고 사항을 의미하거나 구성하지 않습니다. 자세한 내용은 이용 약관을 참고하세요.