Arvind Limited highlights how a broader perspective can clarify deceptive price moves.
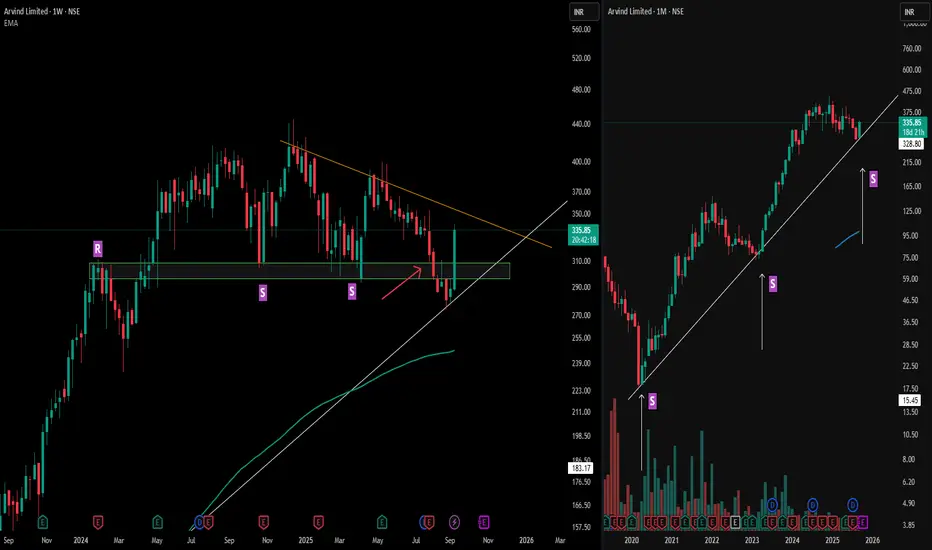
On the left (weekly), resistance ("R") flipped into support ("S") multiple times, with the orange counter trendline framing the recent structure. The red arrow marks a moment when weekly support appeared broken—a classic fake breakdown as price quickly reclaimed the zone with decisive strength.
Looking right (monthly), the MTFA view explains the recovery: a long-standing trendline support anchors the zone, helping absorb downside attempts and fueling the swift reversal. This alignment across timeframes illustrates how long-term technical structures often override short-term volatility, and why reviewing bigger picture charts is essential for pattern validation—not for prediction.
Disclaimer: This analysis is for educational purposes only and does not constitute investment advice. Always do your own research before making financial decisions.
🎯 Master My Self-Made Trading Strategy
📈 Telegram (Learn Today): t.me/hashtaghammer
✅ WhatsApp (Learn Today): wa.me/919455664601
📈 Telegram (Learn Today): t.me/hashtaghammer
✅ WhatsApp (Learn Today): wa.me/919455664601
관련 발행물
면책사항
해당 정보와 게시물은 금융, 투자, 트레이딩 또는 기타 유형의 조언이나 권장 사항으로 간주되지 않으며, 트레이딩뷰에서 제공하거나 보증하는 것이 아닙니다. 자세한 내용은 이용 약관을 참조하세요.