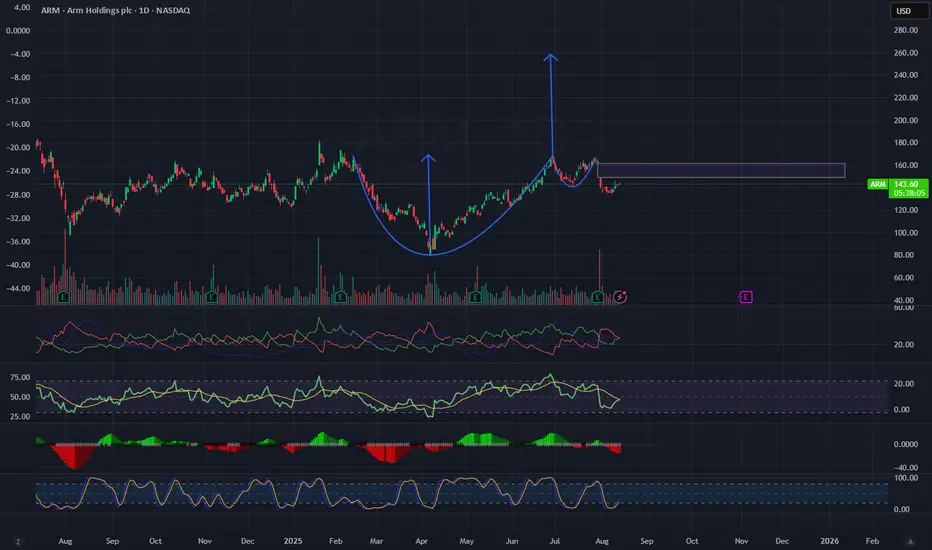
On ARM’s daily chart, we can see a clear Cup & Handle pattern – twice in a row – with strong upward moves following each completion.
The latest pattern completed around the $165 area, after which the stock pulled back into a healthy correction and is now consolidating in the $140–$150 range.
Technical Analysis:
Indicators:
Trade Plan:
Summary:
ARM is showing a classic bullish setup with a strong potential for another upward move. A breakout of the key resistance levels with strong volume could trigger a sharp rally, similar to the previous two bullish waves.
The latest pattern completed around the $165 area, after which the stock pulled back into a healthy correction and is now consolidating in the $140–$150 range.
Technical Analysis:
- Pattern: Cup & Handle with a small pullback, indicating potential re-accumulation.
- Key Support: $140 (a breakdown below would weaken the setup).
- Key Resistance: $150–$155 (a confirmed breakout above could trigger the next bullish leg).
Indicators:
- RSI near 50 – neutral, room to move higher.
- MACD in a correction phase but close to a potential bullish cross.
- ADX showing temporary trend weakness but could strengthen after a breakout.
- Stochastic slightly in overbought territory but not extreme.
- Volume: Decreasing volume during the pullback – a healthy sign for a potential upward breakout.
Trade Plan:
- Entry: On a confirmed breakout above $155 with higher-than-average volume.
- Target 1: $165 (previous resistance).
- Target 2: $180–$185 (depending on momentum strength).
- Stop Loss: Daily close below $140.
Summary:
ARM is showing a classic bullish setup with a strong potential for another upward move. A breakout of the key resistance levels with strong volume could trigger a sharp rally, similar to the previous two bullish waves.
면책사항
이 정보와 게시물은 TradingView에서 제공하거나 보증하는 금융, 투자, 거래 또는 기타 유형의 조언이나 권고 사항을 의미하거나 구성하지 않습니다. 자세한 내용은 이용 약관을 참고하세요.
면책사항
이 정보와 게시물은 TradingView에서 제공하거나 보증하는 금융, 투자, 거래 또는 기타 유형의 조언이나 권고 사항을 의미하거나 구성하지 않습니다. 자세한 내용은 이용 약관을 참고하세요.