An example of how even when prices start lost can find trends.
In a what appears to be a psychological game, investors seem to find what can be found left to start looking for support and resistance lines.
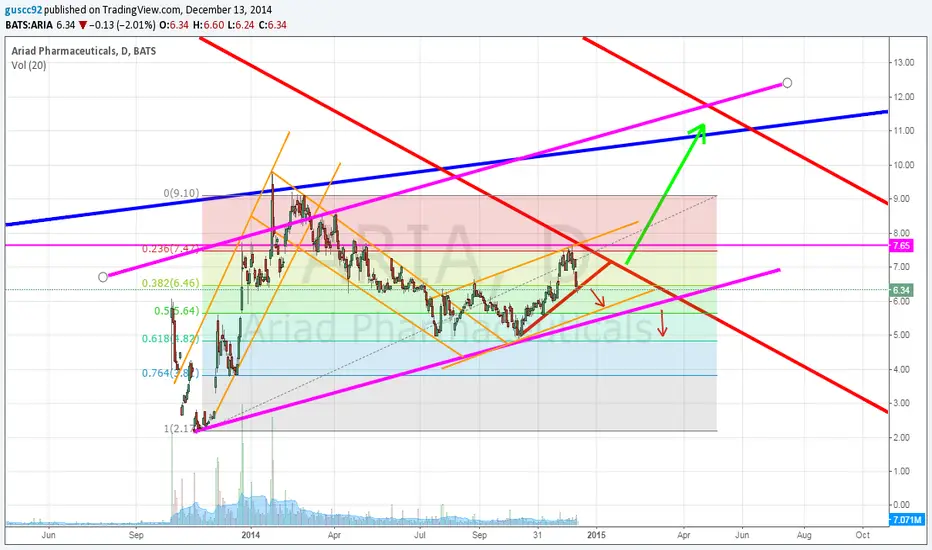
Starting in October from the big price plunge. The first orange trend line was made until it found the blue resistance line, which was an old trend resistance line from 2009 to 2011. With the correction made, it followed the classic 61.8% Fibonacci level, followed by a break up, pull back, and then it hit the resistance level from the last trend line before the plunge.
And for now, it broke the past 2 month trend, so it seems like it won't make another head and follow the latest orange trend line I drew.
So I think it will move a little bit below the red line before continuing going up.
면책사항
이 정보와 게시물은 TradingView에서 제공하거나 보증하는 금융, 투자, 거래 또는 기타 유형의 조언이나 권고 사항을 의미하거나 구성하지 않습니다. 자세한 내용은 이용 약관을 참고하세요.
면책사항
이 정보와 게시물은 TradingView에서 제공하거나 보증하는 금융, 투자, 거래 또는 기타 유형의 조언이나 권고 사항을 의미하거나 구성하지 않습니다. 자세한 내용은 이용 약관을 참고하세요.