Hello
I want to make it simpler for those traders who are not sure about this symbol.
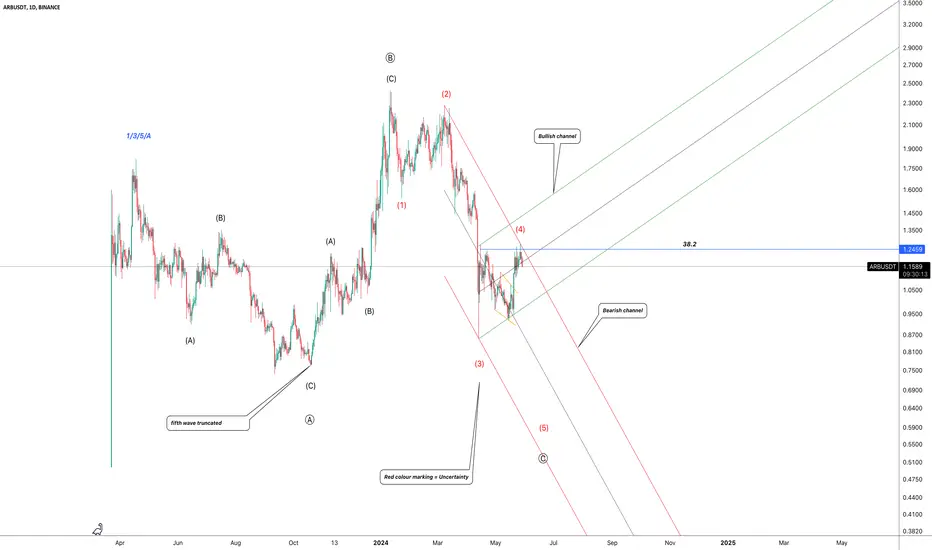
If ARB drops down along side this red boundaries, we can see last bearish fifth wave , but if ARB wants to reverse, so it should break out green channel with strong movements.
Just sit and see for now
Thanks
I want to make it simpler for those traders who are not sure about this symbol.
If ARB drops down along side this red boundaries, we can see last bearish fifth wave , but if ARB wants to reverse, so it should break out green channel with strong movements.
Just sit and see for now
Thanks
노트
Everything depends on our blue 38.2 Fibo level( static resistance ) with 1.2459 USD price.노트
How deep will wave (5) correct, you think?면책사항
해당 정보와 게시물은 금융, 투자, 트레이딩 또는 기타 유형의 조언이나 권장 사항으로 간주되지 않으며, 트레이딩뷰에서 제공하거나 보증하는 것이 아닙니다. 자세한 내용은 이용 약관을 참조하세요.
면책사항
해당 정보와 게시물은 금융, 투자, 트레이딩 또는 기타 유형의 조언이나 권장 사항으로 간주되지 않으며, 트레이딩뷰에서 제공하거나 보증하는 것이 아닙니다. 자세한 내용은 이용 약관을 참조하세요.