📊 Technical Overview:
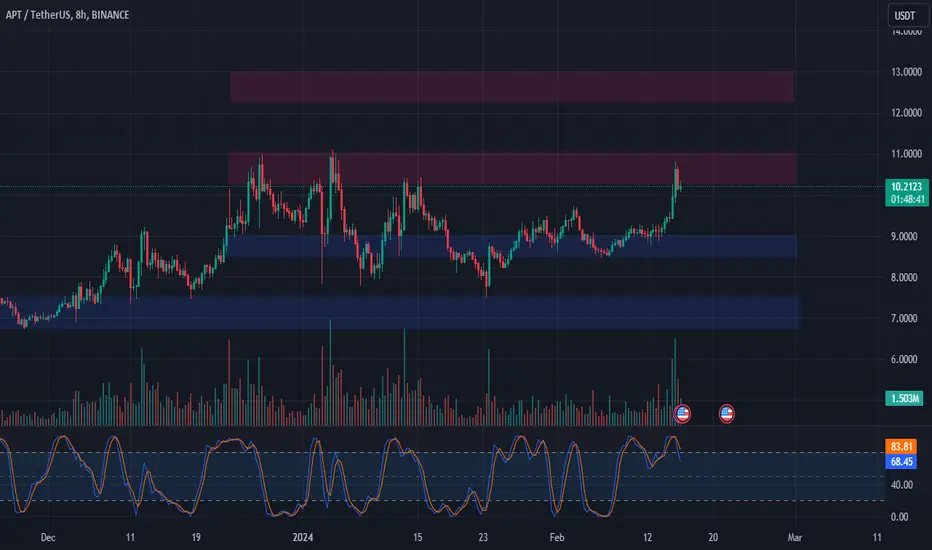
APT: Testing resistance at $10.30 - $11.00.
Key Levels: $10.30, $11.00, $9.00, $12.30, $13.00.
📉📈 Trade Analysis:
Resistance Test: APT testing the resistance area.
Overbought: Overbought on the 8-hour chart.
Support Levels: Potential support at $9.00.
Long Trade Plan: Consider entering a long trade if $9.00 holds.
Profit Targets: $10.30 - $11.00, $12.30 - $13.00.
Potential Gain: Roughly a 45% gain from $9.00 to $13.00.
Stop Loss: Below $8.50.
🚀🔄 Note: Monitor price action around $9.00 and adjust trade strategy accordingly. 📊💡 #APT #TradeAnalysis #StockMarket 📈📉
면책사항
해당 정보와 게시물은 금융, 투자, 트레이딩 또는 기타 유형의 조언이나 권장 사항으로 간주되지 않으며, 트레이딩뷰에서 제공하거나 보증하는 것이 아닙니다. 자세한 내용은 이용 약관을 참조하세요.
면책사항
해당 정보와 게시물은 금융, 투자, 트레이딩 또는 기타 유형의 조언이나 권장 사항으로 간주되지 않으며, 트레이딩뷰에서 제공하거나 보증하는 것이 아닙니다. 자세한 내용은 이용 약관을 참조하세요.