APL APOLLO TUBES LTD - Daily Chart
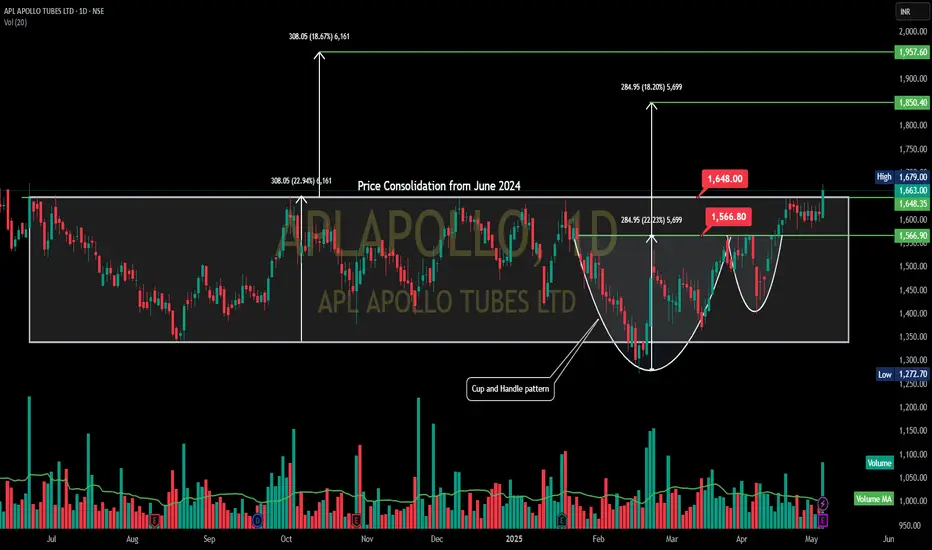
Pattern: The chart shows a period of Price Consolidation from June 2024 within a broad range, roughly between 1,300 and 1,640. Within this larger consolidation, a "Cup and Handle" pattern has formed more recently.
Cup: Formed from approximately mid-February 2025 to mid-April 2025, with the low around 1,272.70.
Handle: A smaller consolidation (handle) formed in late April/early May 2025.
Neckline/Breakout Level: The price is attempting to break out above the neckline of this Cup and Handle, which also coincides with the upper resistance of the broader consolidation range, around 1,640.00 - 1,648.00.
Volume: Volume appears to be increasing on the current breakout attempt from the handle and the larger consolidation.
Target:
The depth of the more recent cup (approximately 284.95 points) projected from the breakout (around 1,586 - which seems to be the C&H neckline) gives a target around 1,850.40.
The height of the larger consolidation (from Oct 2024, approx 308.05 points) projected from the upper boundary breakout (around 1,648) gives a target around 1,957.60. The chart uses both.
Support: The breakout level around 1,640.00 - 1,648.00 is the key immediate support. The low of the cup (1,272.70) is a more significant long-term support.
Resistance: The immediate resistance is the current breakout zone. The projected targets of 1,850.40 and 1,957.60 are the next resistance levels.
Interpretation: APL Apollo is attempting a significant breakout from both a recent Cup and Handle pattern and a longer-term consolidation range. If successful, this could lead to a strong upward move towards the projected targets. The increased volume supports the bullish case. Confirmation above 1,648.00 is key.
면책사항
해당 정보와 게시물은 금융, 투자, 트레이딩 또는 기타 유형의 조언이나 권장 사항으로 간주되지 않으며, 트레이딩뷰에서 제공하거나 보증하는 것이 아닙니다. 자세한 내용은 이용 약관을 참조하세요.
면책사항
해당 정보와 게시물은 금융, 투자, 트레이딩 또는 기타 유형의 조언이나 권장 사항으로 간주되지 않으며, 트레이딩뷰에서 제공하거나 보증하는 것이 아닙니다. 자세한 내용은 이용 약관을 참조하세요.