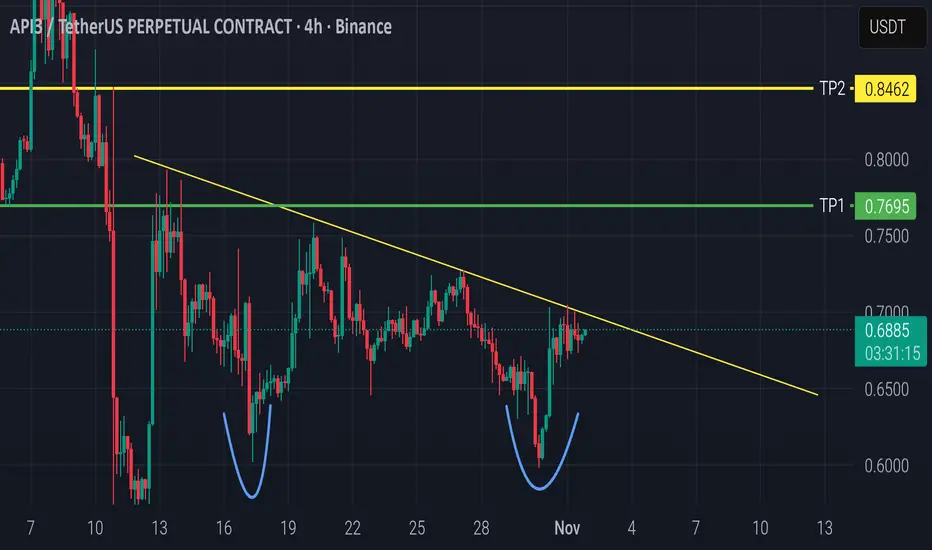
The chart shows a clear Double Bottom pattern around the 0.60 zone, indicating a potential bullish reversal.
Price is now testing the descending trendline (neckline), and a confirmed 4H candle close above 0.69 with strong volume could trigger a breakout move.
🎯 Targets:
TP1: 0.7412
TP2: 0.8462
🛡️ Stop Loss: Below 0.67 or the previous low.
Volume is increasing, supporting the potential breakout — so entry can be considered now if volume keeps rising, or after a retest of the trendline for safer confirmation.
#API3USDT #Crypto #TradingView #TechnicalAnalysis #DoubleBottom #TrendlineBreakout
면책사항
해당 정보와 게시물은 금융, 투자, 트레이딩 또는 기타 유형의 조언이나 권장 사항으로 간주되지 않으며, 트레이딩뷰에서 제공하거나 보증하는 것이 아닙니다. 자세한 내용은 이용 약관을 참조하세요.
면책사항
해당 정보와 게시물은 금융, 투자, 트레이딩 또는 기타 유형의 조언이나 권장 사항으로 간주되지 않으며, 트레이딩뷰에서 제공하거나 보증하는 것이 아닙니다. 자세한 내용은 이용 약관을 참조하세요.