I've been asked to analyse APE so here it is my point of view.
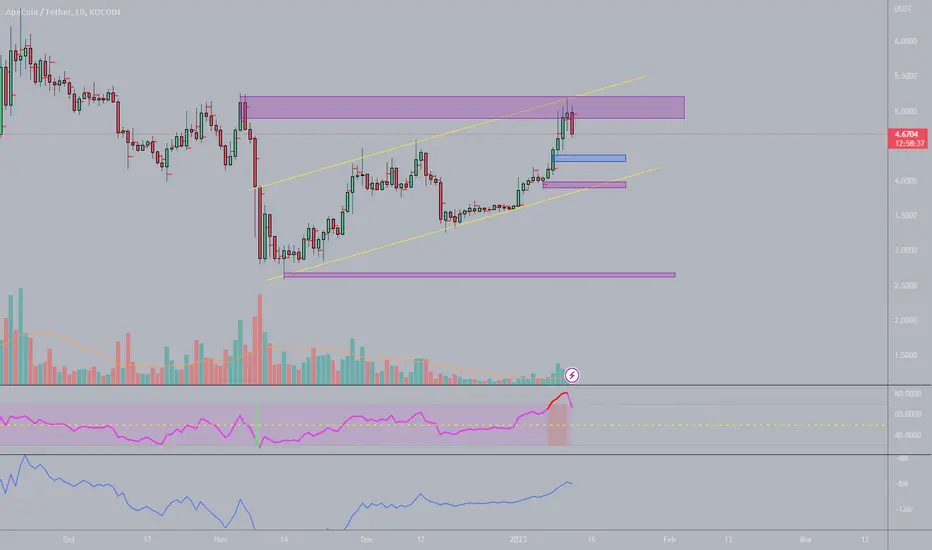
This seems a lot a bear flag, I don't think it could be a revival triangle pattern because volume is lowering, because I don't think market has bottomed and because I would have expected a left side of the triangle to be created from bottom to top and here is the opposite.
My opinion is that this is going to dump, you can see my two levels where price could slow down inside the flag. As price has bottomed I used Fib extension to see what could be the next bottom: and it is around 1 USDT
If you wanna attempt a short it's likely the best two entries are gone:
you could try to enterer around 4.9 USDT if price gets back there.
Good luck
This seems a lot a bear flag, I don't think it could be a revival triangle pattern because volume is lowering, because I don't think market has bottomed and because I would have expected a left side of the triangle to be created from bottom to top and here is the opposite.
My opinion is that this is going to dump, you can see my two levels where price could slow down inside the flag. As price has bottomed I used Fib extension to see what could be the next bottom:
If you wanna attempt a short it's likely the best two entries are gone:
you could try to enterer around 4.9 USDT if price gets back there.
Good luck
I do TA because I like and it seems at least 70% of my calls usually turn out to be true. If you wanna support me please donate some tradingview coin or check "about me"
면책사항
이 정보와 게시물은 TradingView에서 제공하거나 보증하는 금융, 투자, 거래 또는 기타 유형의 조언이나 권고 사항을 의미하거나 구성하지 않습니다. 자세한 내용은 이용 약관을 참고하세요.
I do TA because I like and it seems at least 70% of my calls usually turn out to be true. If you wanna support me please donate some tradingview coin or check "about me"
면책사항
이 정보와 게시물은 TradingView에서 제공하거나 보증하는 금융, 투자, 거래 또는 기타 유형의 조언이나 권고 사항을 의미하거나 구성하지 않습니다. 자세한 내용은 이용 약관을 참고하세요.