Crystal ball has spoken, AMZN is due for a small DIP.
Trend Analysis:
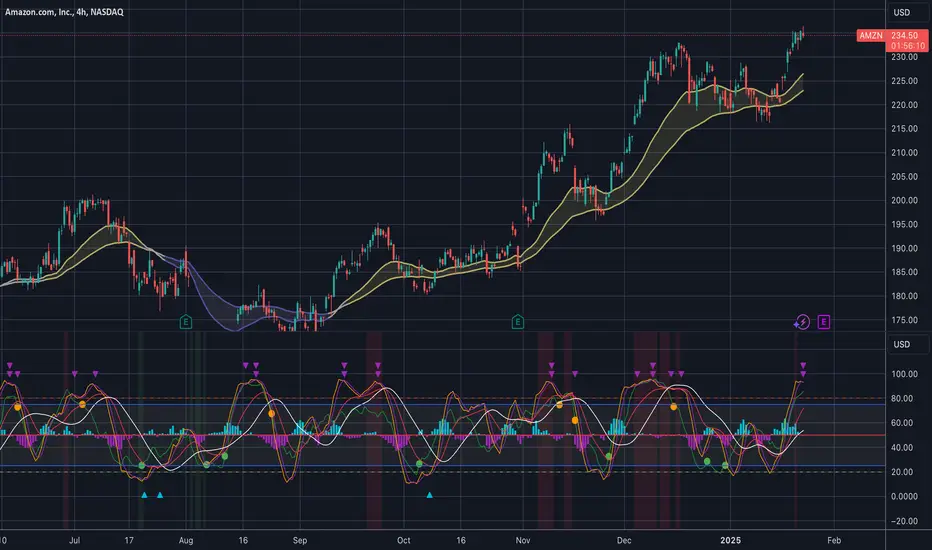
• The price is trading in an overall uptrend, respecting the 50 EMA (yellow) and 20 EMA (gold), indicating strong bullish momentum.
• Recent price action has formed higher highs and higher lows, maintaining bullish structure.
JP StochDemark Indicator Insights:
• The indicator is approaching overbought levels, currently crossing above the 80 threshold, which signals potential exhaustion in the short term.
• Bearish divergence is forming as price makes new highs while the indicator fails to confirm.
• Previous occurrences of such setups led to short-term pullbacks before continuation.
Support & Resistance Levels:
• Immediate resistance at $236-$238, aligning with recent highs.
• Short-term support at $225, where moving averages align.
• Strong demand zone around $210-$215, coinciding with prior consolidation.
Trade Signal & Probability:
Bullish Bias: Continuation likely if price sustains above $230 with momentum confirmation.
Bearish Pullback: A corrective dip to the $225 zone is probable if momentum weakens.
Target Levels: Upside targets at $240 (psychological resistance) and $250 if momentum persists.
Risk Levels: Watch for breakdown below $225, which could trigger further downside to $215.
Conclusion:
Momentum remains bullish but overbought signals suggest caution.
Monitor for a healthy retracement before continuation. A break above $238 could confirm further bullish momentum.
Like the analysis? Follow, Subscribe for more...
Trend Analysis:
• The price is trading in an overall uptrend, respecting the 50 EMA (yellow) and 20 EMA (gold), indicating strong bullish momentum.
• Recent price action has formed higher highs and higher lows, maintaining bullish structure.
JP StochDemark Indicator Insights:
• The indicator is approaching overbought levels, currently crossing above the 80 threshold, which signals potential exhaustion in the short term.
• Bearish divergence is forming as price makes new highs while the indicator fails to confirm.
• Previous occurrences of such setups led to short-term pullbacks before continuation.
Support & Resistance Levels:
• Immediate resistance at $236-$238, aligning with recent highs.
• Short-term support at $225, where moving averages align.
• Strong demand zone around $210-$215, coinciding with prior consolidation.
Trade Signal & Probability:
Bullish Bias: Continuation likely if price sustains above $230 with momentum confirmation.
Bearish Pullback: A corrective dip to the $225 zone is probable if momentum weakens.
Target Levels: Upside targets at $240 (psychological resistance) and $250 if momentum persists.
Risk Levels: Watch for breakdown below $225, which could trigger further downside to $215.
Conclusion:
Momentum remains bullish but overbought signals suggest caution.
Monitor for a healthy retracement before continuation. A break above $238 could confirm further bullish momentum.
Like the analysis? Follow, Subscribe for more...
면책사항
이 정보와 게시물은 TradingView에서 제공하거나 보증하는 금융, 투자, 거래 또는 기타 유형의 조언이나 권고 사항을 의미하거나 구성하지 않습니다. 자세한 내용은 이용 약관을 참고하세요.
면책사항
이 정보와 게시물은 TradingView에서 제공하거나 보증하는 금융, 투자, 거래 또는 기타 유형의 조언이나 권고 사항을 의미하거나 구성하지 않습니다. 자세한 내용은 이용 약관을 참고하세요.