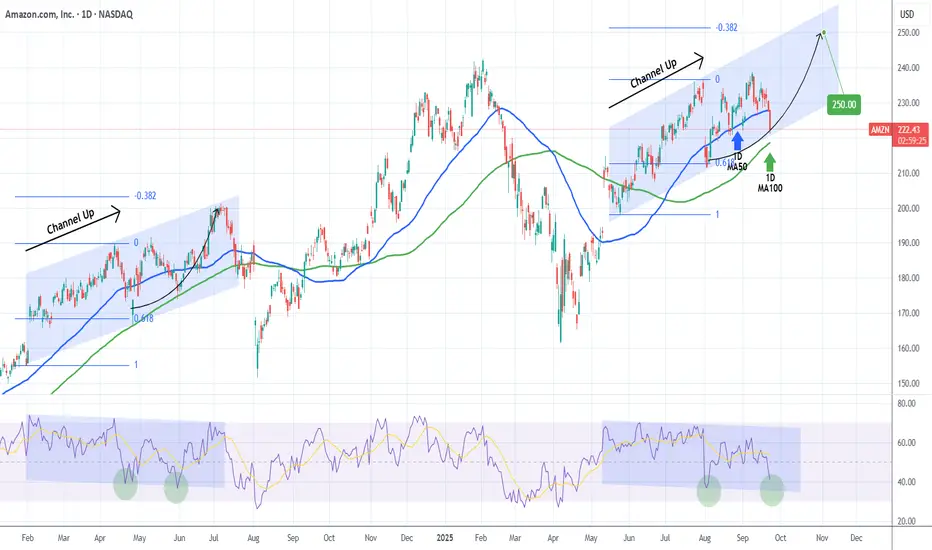
Amazon Inc. (AMZN) has been trading within a 4-month Channel Up and is currently pulling back on a Bearish Leg. The 1D MA100 (green trend-line) is just below and last time a similar Channel Up found support on it (May 31 2024), it rebounded for a -0.382 Fibonacci extension top.
As you can see, both patterns are identical, even making their first Higher Lows on their respective 0.618 Fib. Even their 1D RSI fractals are similar and right now we are headed of the 2nd Low (green circle).
As a result, we expect a bullish reversal there, targeting a little under $250 (Fib -0.382 ext).
-------------------------------------------------------------------------------
** Please LIKE 👍, FOLLOW ✅, SHARE 🙌 and COMMENT ✍ if you enjoy this idea! Also share your ideas and charts in the comments section below! This is best way to keep it relevant, support us, keep the content here free and allow the idea to reach as many people as possible. **
-------------------------------------------------------------------------------
💸💸💸💸💸💸
👇 👇 👇 👇 👇 👇
👑Best Signals (Forex/Crypto+70% accuracy) & Account Management (+20% profit/month on 10k accounts)
💰Free Channel t.me/tradingshotglobal
🤵Contact info@tradingshot.com t.me/tradingshot
🔥New service: next X100 crypto GEMS!
💰Free Channel t.me/tradingshotglobal
🤵Contact info@tradingshot.com t.me/tradingshot
🔥New service: next X100 crypto GEMS!
면책사항
해당 정보와 게시물은 금융, 투자, 트레이딩 또는 기타 유형의 조언이나 권장 사항으로 간주되지 않으며, 트레이딩뷰에서 제공하거나 보증하는 것이 아닙니다. 자세한 내용은 이용 약관을 참조하세요.