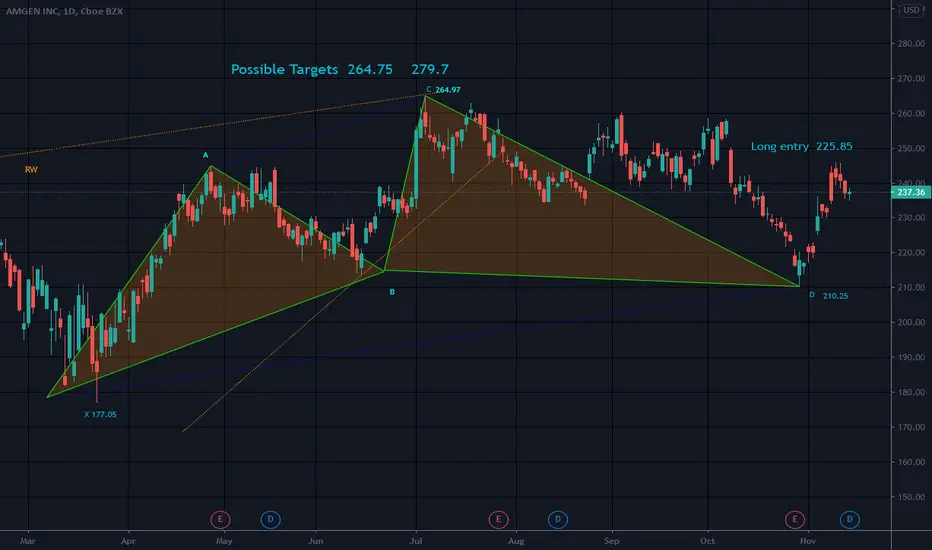
Possible stop below D or 210.75
Possible long term targets 321.9 to 352
Amgen tried to break out several weeks ago and did not hit targets. Perhaps the bearish rising wedge won the battle
It has been a bit stagnant for a while but is over LE level for this pattern
The cypher is a five point harmonic chart pattern, made up of points XABCD. The cypher is easy to spot on a chart because it has a characteristic wave like appearance displaying either rising peaks or falling valleys.
In any cypher, points X, C and D are the critical points. For a bullish cypher, X should be the pattern low and C the pattern high. A bearish cypher makes its high at X and its low at D.
The cypher is a technical wave pattern in which the market is trending but is making sharp reversals along the way.
면책사항
이 정보와 게시물은 TradingView에서 제공하거나 보증하는 금융, 투자, 거래 또는 기타 유형의 조언이나 권고 사항을 의미하거나 구성하지 않습니다. 자세한 내용은 이용 약관을 참고하세요.
면책사항
이 정보와 게시물은 TradingView에서 제공하거나 보증하는 금융, 투자, 거래 또는 기타 유형의 조언이나 권고 사항을 의미하거나 구성하지 않습니다. 자세한 내용은 이용 약관을 참고하세요.
