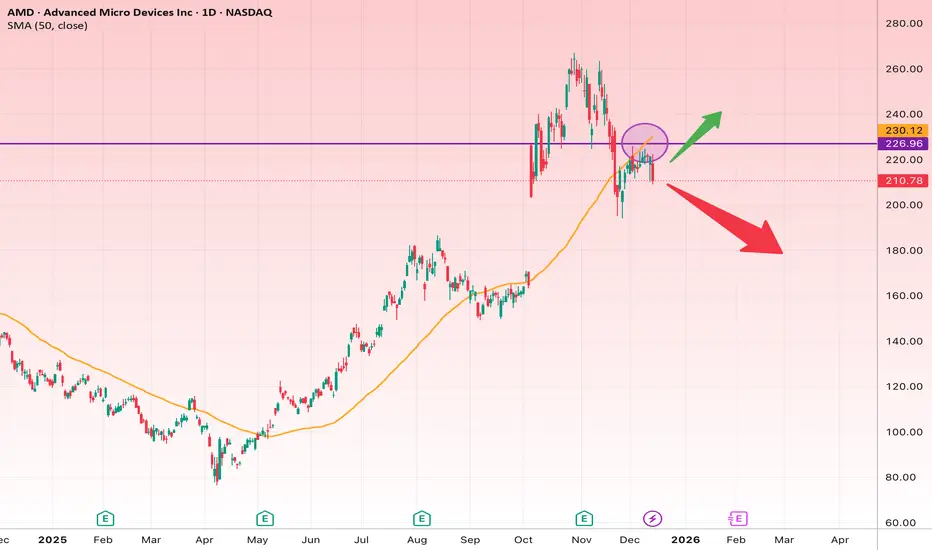
After a strong bullish impulse, AMD has entered a corrective phase and is currently trading below the 50-day SMA (around 230) and under a key horizontal resistance zone at 226–230.
The circled area highlights a clear rejection from resistance combined with the SMA, making this zone critical for the next directional move.
Bullish Scenario
If price achieves a daily close above 230:
Targets
• Target 1: 245
• Target 2: 260
• Target 3: 275–280
Stop Loss
• Daily close below 218
Rationale:
Breakout above a major resistance and reclaiming the 50 SMA would signal trend continuation and renewed bullish momentum.
Bearish Scenario
If price loses the 205–210 support zone:
Targets
• Target 1: 195
• Target 2: 180
• Target 3: 165
Stop Loss
• Reclaim and daily close above 225
Rationale:
Repeated rejection from resistance, weakening momentum, and a deeper correction following an extended rally.
Very Short Summary
Above 230 → Bullish continuation
Below 210 → Deeper correction likely
면책사항
해당 정보와 게시물은 금융, 투자, 트레이딩 또는 기타 유형의 조언이나 권장 사항으로 간주되지 않으며, 트레이딩뷰에서 제공하거나 보증하는 것이 아닙니다. 자세한 내용은 이용 약관을 참조하세요.
면책사항
해당 정보와 게시물은 금융, 투자, 트레이딩 또는 기타 유형의 조언이나 권장 사항으로 간주되지 않으며, 트레이딩뷰에서 제공하거나 보증하는 것이 아닙니다. 자세한 내용은 이용 약관을 참조하세요.