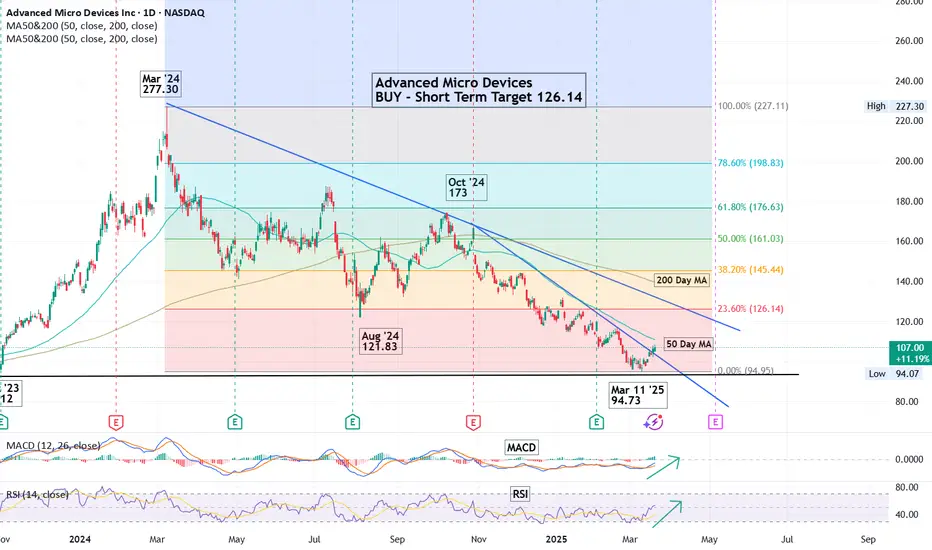
Trendline: Downtrend, connect lower highs and draw a line.
Fibonacci Retracements: High to Low for the period will show where the potential resistance
levels are.
Support Levels: Price held support from previous levels.
For Educational Purposes Only. Not a recommendation to buy or sell.
Fibonacci Retracements: High to Low for the period will show where the potential resistance
levels are.
Support Levels: Price held support from previous levels.
For Educational Purposes Only. Not a recommendation to buy or sell.
면책사항
해당 정보와 게시물은 금융, 투자, 트레이딩 또는 기타 유형의 조언이나 권장 사항으로 간주되지 않으며, 트레이딩뷰에서 제공하거나 보증하는 것이 아닙니다. 자세한 내용은 이용 약관을 참조하세요.
면책사항
해당 정보와 게시물은 금융, 투자, 트레이딩 또는 기타 유형의 조언이나 권장 사항으로 간주되지 않으며, 트레이딩뷰에서 제공하거나 보증하는 것이 아닙니다. 자세한 내용은 이용 약관을 참조하세요.