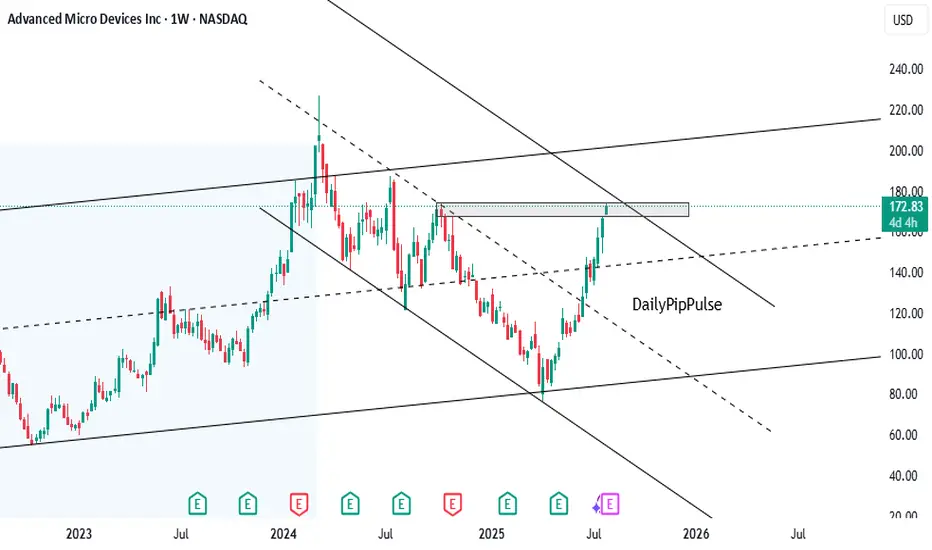
the weekly price action of Advanced Micro Devices Inc (AMD):The stock is trading near a critical resistance zone marked with a rectangular box just below $180.In the past, this area acted as a rejection point, evident from prior pullbacks when the stock neared these levels.
The chart reflects a larger declining channel. Current price action shows AMD approaching the upper boundary of this channel, which may act as dynamic resistance.
If AMD breaks above the $180 resistance convincingly, there’s potential for the stock to aim for higher targets, such as the next major zone ($240).
Failure to break above $180 may lead to a retest of lower levels, potentially near $140 or the breakout zone ($100-$120).
면책사항
해당 정보와 게시물은 금융, 투자, 트레이딩 또는 기타 유형의 조언이나 권장 사항으로 간주되지 않으며, 트레이딩뷰에서 제공하거나 보증하는 것이 아닙니다. 자세한 내용은 이용 약관을 참조하세요.
면책사항
해당 정보와 게시물은 금융, 투자, 트레이딩 또는 기타 유형의 조언이나 권장 사항으로 간주되지 않으며, 트레이딩뷰에서 제공하거나 보증하는 것이 아닙니다. 자세한 내용은 이용 약관을 참조하세요.